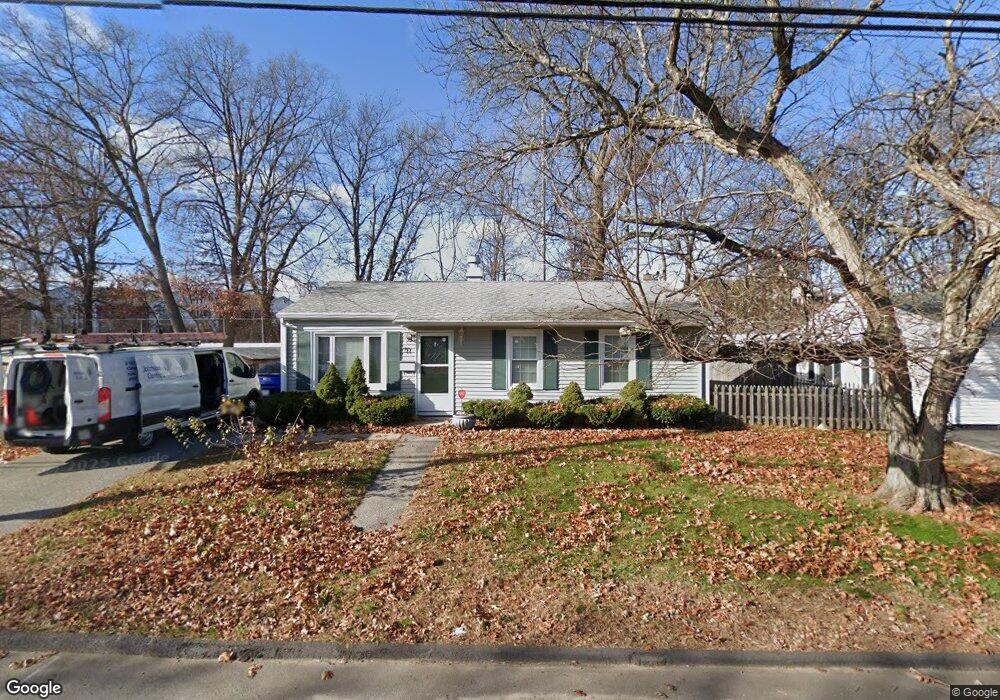
71 Amherst St Lawrence, MA 01843
Mount Vernon NeighborhoodEstimated Value: $458,000 - $576,000
4
Beds
1
Bath
1,369
Sq Ft
$381/Sq Ft
Est. Value
About This Home
This home is located at 71 Amherst St, Lawrence, MA 01843 and is currently estimated at $521,004, approximately $380 per square foot. 71 Amherst St is a home located in Essex County with nearby schools including John Breen School, School For Exceptional Studies, and Robert Frost Middle School.
Ownership History
Date
Name
Owned For
Owner Type
Purchase Details
Closed on
Jan 26, 2007
Sold by
Sweeney Justin
Bought by
Tejada Ruth A
Current Estimated Value
Home Financials for this Owner
Home Financials are based on the most recent Mortgage that was taken out on this home.
Original Mortgage
$244,900
Outstanding Balance
$144,370
Interest Rate
6.15%
Mortgage Type
Purchase Money Mortgage
Estimated Equity
$376,634
Purchase Details
Closed on
Oct 3, 2005
Sold by
Schneider Louis H and Schneider Roberta
Bought by
Sweeney Justin
Home Financials for this Owner
Home Financials are based on the most recent Mortgage that was taken out on this home.
Original Mortgage
$200,000
Interest Rate
5.84%
Mortgage Type
Purchase Money Mortgage
Purchase Details
Closed on
Sep 4, 1998
Sold by
Thornhill N Eugene
Bought by
Schneider Louis H
Create a Home Valuation Report for This Property
The Home Valuation Report is an in-depth analysis detailing your home's value as well as a comparison with similar homes in the area
Home Values in the Area
Average Home Value in this Area
Purchase History
| Date | Buyer | Sale Price | Title Company |
|---|---|---|---|
| Tejada Ruth A | $244,900 | -- | |
| Sweeney Justin | $250,000 | -- | |
| Schneider Louis H | $83,000 | -- |
Source: Public Records
Mortgage History
| Date | Status | Borrower | Loan Amount |
|---|---|---|---|
| Open | Tejada Ruth A | $244,900 | |
| Previous Owner | Sweeney Justin | $200,000 | |
| Previous Owner | Schneider Louis H | $147,000 | |
| Previous Owner | Schneider Louis H | $132,035 |
Source: Public Records
Tax History
| Year | Tax Paid | Tax Assessment Tax Assessment Total Assessment is a certain percentage of the fair market value that is determined by local assessors to be the total taxable value of land and additions on the property. | Land | Improvement |
|---|---|---|---|---|
| 2025 | $3,949 | $448,700 | $142,200 | $306,500 |
| 2024 | $3,810 | $411,900 | $128,100 | $283,800 |
| 2023 | $3,856 | $379,500 | $113,700 | $265,800 |
| 2022 | $3,775 | $330,000 | $107,400 | $222,600 |
| 2021 | $3,512 | $286,200 | $103,700 | $182,500 |
| 2020 | $3,390 | $272,700 | $90,200 | $182,500 |
| 2019 | $3,372 | $246,500 | $79,900 | $166,600 |
| 2018 | $3,155 | $220,300 | $79,900 | $140,400 |
| 2017 | $3,160 | $206,000 | $79,900 | $126,100 |
| 2016 | $2,416 | $155,800 | $52,100 | $103,700 |
| 2015 | $2,224 | $147,100 | $43,400 | $103,700 |
Source: Public Records
Map
Nearby Homes
- 543 Andover St Unit 6
- 35 Adams St
- 37 Tewksbury St Unit 39
- 33-35 Coolidge St
- 11 W Hawley St
- 91-93 Newton St
- 49 Bowdoin St Unit 51
- 0
- 87-87A Brookfield St
- 312 Water St Unit 4
- 18 Doyle St
- 24 Inman St Unit 4
- 341 S Broadway- Parcel II
- 29 Westchester Dr
- 5 Crestwood Cir
- 19 Oregon Ave
- 12B Stevens St
- 102 Weare St
- 82 S Broadway
- 31 Garfield St
- 69 Amherst St
- 67 Amherst St
- 72 Amherst St
- 70 Amherst St
- 68 Amherst St
- 76 Amherst St
- 65 Amherst St
- 85 Amherst St Unit 87
- 85-87 Amherst St
- 66 Amherst St
- 49 S Bowdoin St
- 49 S Bowdoin St Unit 51
- 47 S Bowdoin St
- 78 Amherst St
- 45 S Bowdoin St
- 63 Amherst St
- 89 Amherst St
- 51 S Bowdoin St
- 89-91 Amherst St
- 64 Amherst St
Your Personal Tour Guide
Ask me questions while you tour the home.