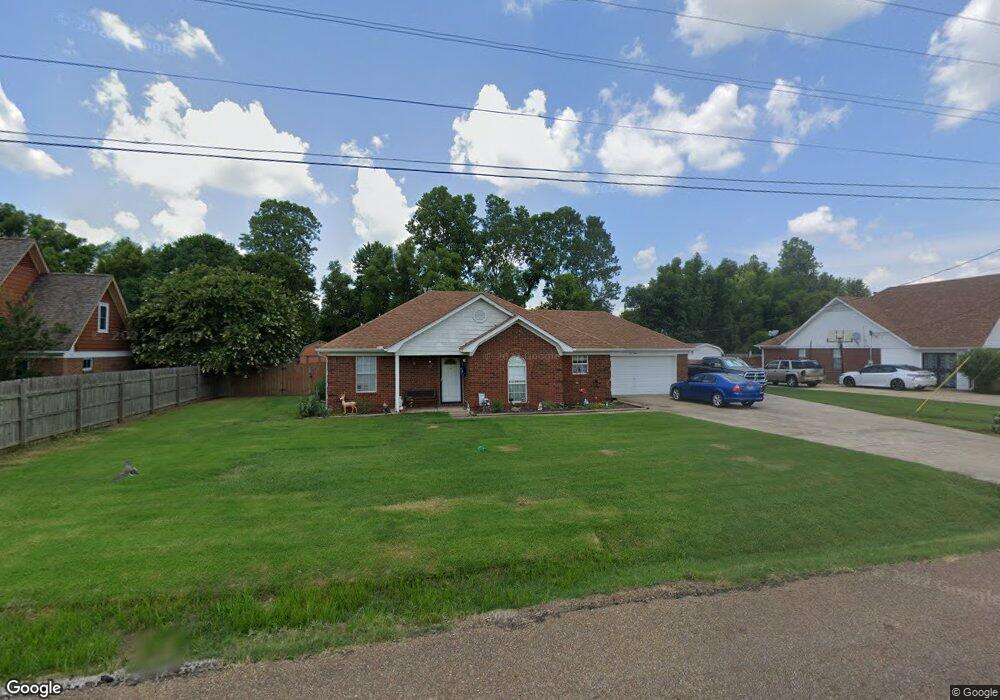
71 Andy Dr Drummonds, TN 38023
Estimated Value: $258,050 - $287,000
Studio
2
Baths
1,540
Sq Ft
$178/Sq Ft
Est. Value
About This Home
This home is located at 71 Andy Dr, Drummonds, TN 38023 and is currently estimated at $273,513, approximately $177 per square foot. 71 Andy Dr is a home located in Tipton County with nearby schools including Drummonds Elementary School, Munford Middle School, and Munford High School.
Ownership History
Date
Name
Owned For
Owner Type
Purchase Details
Closed on
Feb 26, 2002
Bought by
Blurton Robert N
Current Estimated Value
Home Financials for this Owner
Home Financials are based on the most recent Mortgage that was taken out on this home.
Original Mortgage
$85,050
Outstanding Balance
$34,170
Interest Rate
6.95%
Estimated Equity
$239,343
Purchase Details
Closed on
Dec 4, 2001
Sold by
Kirsch Joe M Sub Trustee
Bought by
Secretary Of Housing & Urb
Purchase Details
Closed on
Jul 10, 2000
Sold by
Bell David G
Bought by
Hwa Bell Kil
Purchase Details
Closed on
May 8, 2000
Sold by
Mosley Laura F
Bought by
Bell David G
Purchase Details
Closed on
Oct 31, 1996
Bought by
Mosley Laura F
Purchase Details
Closed on
Mar 4, 1996
Bought by
Alfred Cooper
Purchase Details
Closed on
Dec 19, 1995
Bought by
Cooper Alfred and Cooper Lucille
Purchase Details
Closed on
Apr 10, 1990
Bought by
Cole Heights Subdivision Inc
Create a Home Valuation Report for This Property
The Home Valuation Report is an in-depth analysis detailing your home's value as well as a comparison with similar homes in the area
Home Values in the Area
Average Home Value in this Area
Purchase History
| Date | Buyer | Sale Price | Title Company |
|---|---|---|---|
| Blurton Robert N | $85,051 | -- | |
| Secretary Of Housing & Urb | -- | -- | |
| Hwa Bell Kil | -- | -- | |
| Bell David G | $103,900 | -- | |
| Mosley Laura F | $91,900 | -- | |
| Alfred Cooper | $10,000 | -- | |
| Cooper Alfred | $10,000 | -- | |
| Cole Heights Subdivision Inc | -- | -- |
Source: Public Records
Mortgage History
| Date | Status | Borrower | Loan Amount |
|---|---|---|---|
| Open | Cole Heights Subdivision Inc | $85,050 |
Source: Public Records
Tax History
| Year | Tax Paid | Tax Assessment Tax Assessment Total Assessment is a certain percentage of the fair market value that is determined by local assessors to be the total taxable value of land and additions on the property. | Land | Improvement |
|---|---|---|---|---|
| 2025 | $929 | $61,050 | $9,000 | $52,050 |
| 2024 | $929 | $61,050 | $9,000 | $52,050 |
| 2023 | $929 | $61,050 | $9,000 | $52,050 |
| 2022 | $880 | $43,150 | $6,625 | $36,525 |
| 2021 | $880 | $43,150 | $6,625 | $36,525 |
| 2020 | $880 | $43,150 | $6,625 | $36,525 |
| 2019 | $851 | $35,150 | $5,100 | $30,050 |
| 2018 | $851 | $35,150 | $5,100 | $30,050 |
| 2017 | $851 | $35,150 | $5,100 | $30,050 |
| 2016 | $851 | $35,150 | $5,100 | $30,050 |
| 2015 | $850 | $35,150 | $5,100 | $30,050 |
| 2014 | $849 | $35,143 | $0 | $0 |
Source: Public Records
Map
Nearby Homes
- 273 Andy Dr
- 1368 Mathis Rd
- 335 Pintail Cir
- 121 Reed Cir
- 0 Reed Cir Unit 10192357
- 205 Hackberry Cove
- 0 Simmons Rd Unit 10213607
- 344 Elsberry St
- 410 Brown Rd
- 384 Tipton Lake Cir W
- 0 Bethuel Church Rd Unit RTC2971170
- 511 Rae Dr
- 59 Rose Bush St
- 33 Rose Bush St
- 447 Abbey Rd Unit D
- 447 Abbey Rd Unit A
- 53 Rose Bush St
- 47 Rose Bush St
- 39 Rose Bush St
- 27 Rose Bush St
- 51 Andy Dr
- 91 Andy Dr
- 133 Meadowbrook Rd
- 29 Andy Dr
- 113 Andy Dr
- 166 Misty Meadow Trail
- 11 Andy Dr
- 316 Country Meadow Ln
- 111 Meadowbrook Rd
- 300 Country Meadow Ln
- 134 Misty Meadow Trail
- 280 Country Meadow Ln
- 151 Andy Dr
- 336 Country Meadow Ln
- 260 Country Meadow Ln
- 94 Meadowbrook Rd
- 114 Misty Meadow Trail
- 95 Meadowbrook Rd
- 360 Country Meadow Ln
- 195 Misty Meadow Trail
Your Personal Tour Guide
Ask me questions while you tour the home.