71 Asselin St Chicopee, MA 01020
Fairview NeighborhoodEstimated Value: $335,000 - $358,000
4
Beds
1
Bath
1,351
Sq Ft
$258/Sq Ft
Est. Value
About This Home
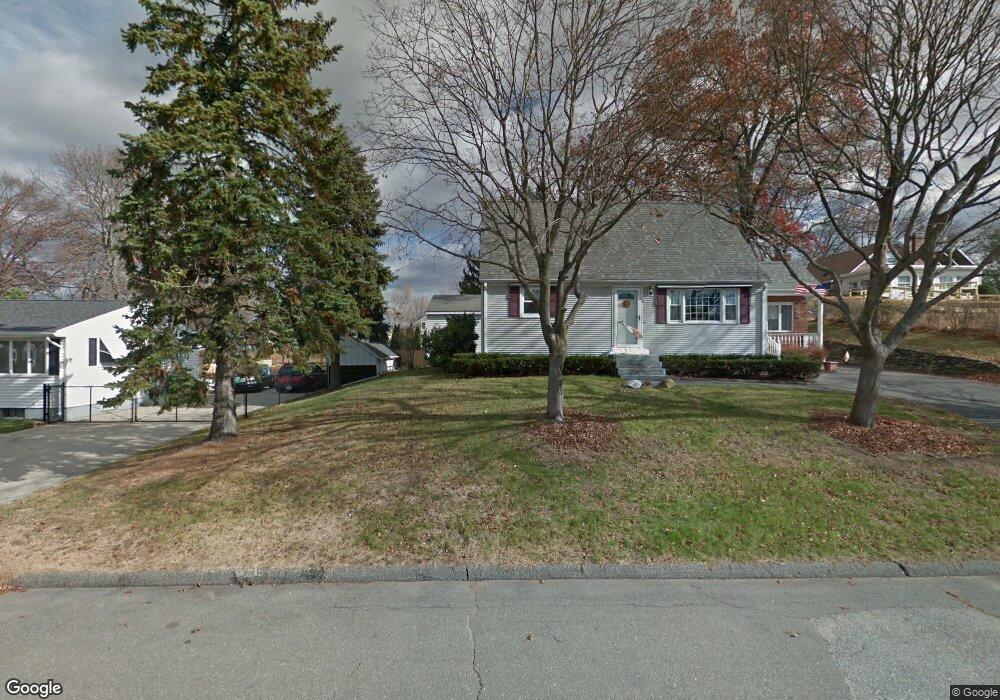
This home is located at 71 Asselin St, Chicopee, MA 01020 and is currently estimated at $347,975, approximately $257 per square foot. 71 Asselin St is a home located in Hampden County with nearby schools including Bowie Elementary School, Fairview Middle School, and Chicopee Comprehensive High School.
Ownership History
Date
Name
Owned For
Owner Type
Purchase Details
Closed on
Jan 25, 2017
Sold by
Blais Lynn A and Blais Brian R
Bought by
Blais Lynn A and Blais Brian R
Current Estimated Value
Purchase Details
Closed on
Jan 9, 2009
Sold by
Roe Thomas J and Roe Cindy A
Bought by
Blais Lynn A and Blais Brian R
Home Financials for this Owner
Home Financials are based on the most recent Mortgage that was taken out on this home.
Original Mortgage
$188,100
Interest Rate
5.99%
Mortgage Type
Purchase Money Mortgage
Purchase Details
Closed on
Jun 29, 2007
Sold by
Giroux Normand A and Giroux Sandra J
Bought by
Roe Cindy A and Roe Thomas J
Home Financials for this Owner
Home Financials are based on the most recent Mortgage that was taken out on this home.
Original Mortgage
$226,980
Interest Rate
6.24%
Mortgage Type
Purchase Money Mortgage
Create a Home Valuation Report for This Property
The Home Valuation Report is an in-depth analysis detailing your home's value as well as a comparison with similar homes in the area
Home Values in the Area
Average Home Value in this Area
Purchase History
| Date | Buyer | Sale Price | Title Company |
|---|---|---|---|
| Blais Lynn A | -- | -- | |
| Blais Lynn A | $209,000 | -- | |
| Roe Cindy A | $234,000 | -- |
Source: Public Records
Mortgage History
| Date | Status | Borrower | Loan Amount |
|---|---|---|---|
| Previous Owner | Blais Lynn A | $188,100 | |
| Previous Owner | Roe Cindy A | $226,980 |
Source: Public Records
Tax History Compared to Growth
Tax History
| Year | Tax Paid | Tax Assessment Tax Assessment Total Assessment is a certain percentage of the fair market value that is determined by local assessors to be the total taxable value of land and additions on the property. | Land | Improvement |
|---|---|---|---|---|
| 2025 | $4,272 | $281,800 | $114,500 | $167,300 |
| 2024 | $4,127 | $279,600 | $112,300 | $167,300 |
| 2023 | $3,881 | $256,200 | $102,100 | $154,100 |
| 2022 | $3,821 | $224,900 | $88,800 | $136,100 |
| 2021 | $3,689 | $209,500 | $80,700 | $128,800 |
| 2020 | $3,565 | $204,200 | $82,900 | $121,300 |
| 2019 | $3,535 | $196,800 | $82,900 | $113,900 |
| 2018 | $2,581 | $186,000 | $78,900 | $107,100 |
| 2017 | $2,962 | $171,100 | $72,300 | $98,800 |
| 2016 | $2,959 | $175,000 | $72,300 | $102,700 |
| 2015 | $3,017 | $172,000 | $72,300 | $99,700 |
| 2014 | $1,508 | $172,000 | $72,300 | $99,700 |
Source: Public Records
Map
Nearby Homes
- 34 Deslauriers St
- 71 Greenwood Terrace
- 40 Greenwood Terrace
- 29 Meadowlark Ln
- 1640 Westover Rd
- 1601 Westover Rd
- 98 Greenpoint Cir
- 111 Festival Cir
- 24 Festival Cir
- 340 Pendleton Ave
- 103 Lauzier Terrace
- 735 Memorial Dr Unit 40
- 81 Mccarthy Ave
- 585 Sheridan St Unit 44
- 585 Sheridan St Unit 12
- 585 Sheridan St Unit 46
- 519 Prospect St
- 196 Pendleton Ave
- 442 Prospect St
- 162 Pendleton Ave