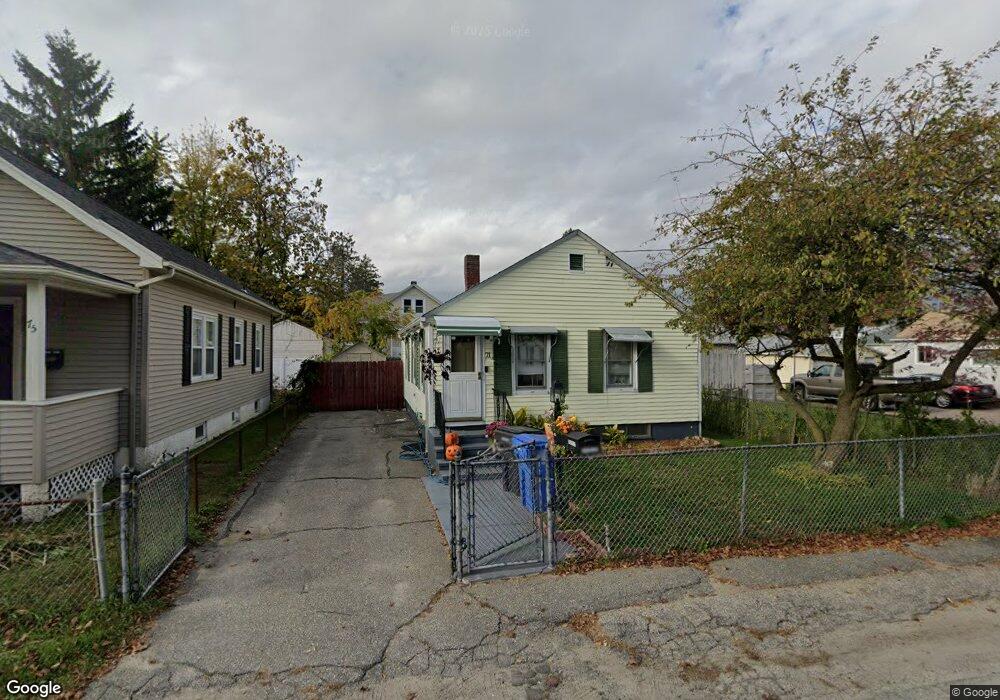
71 Berkley St Cranston, RI 02910
Stadium NeighborhoodEstimated Value: $308,000 - $383,000
2
Beds
1
Bath
660
Sq Ft
$502/Sq Ft
Est. Value
About This Home
This home is located at 71 Berkley St, Cranston, RI 02910 and is currently estimated at $331,541, approximately $502 per square foot. 71 Berkley St is a home located in Providence County with nearby schools including Stadium Elementary School, Hugh B. Bain Middle School, and Cranston High School East.
Ownership History
Date
Name
Owned For
Owner Type
Purchase Details
Closed on
Apr 30, 2007
Sold by
Ball Denice A
Bought by
Trindale Marisol and Trindale Rui
Current Estimated Value
Home Financials for this Owner
Home Financials are based on the most recent Mortgage that was taken out on this home.
Original Mortgage
$178,500
Outstanding Balance
$108,104
Interest Rate
6.18%
Mortgage Type
Purchase Money Mortgage
Estimated Equity
$223,437
Purchase Details
Closed on
Jun 23, 2004
Sold by
Strong Edna and Strong Howard
Bought by
Ball Denice
Home Financials for this Owner
Home Financials are based on the most recent Mortgage that was taken out on this home.
Original Mortgage
$118,800
Interest Rate
6.32%
Mortgage Type
Purchase Money Mortgage
Create a Home Valuation Report for This Property
The Home Valuation Report is an in-depth analysis detailing your home's value as well as a comparison with similar homes in the area
Home Values in the Area
Average Home Value in this Area
Purchase History
| Date | Buyer | Sale Price | Title Company |
|---|---|---|---|
| Trindale Marisol | $225,000 | -- | |
| Ball Denice | $149,000 | -- |
Source: Public Records
Mortgage History
| Date | Status | Borrower | Loan Amount |
|---|---|---|---|
| Open | Ball Denice | $178,500 | |
| Previous Owner | Ball Denice | $164,700 | |
| Previous Owner | Ball Denice | $118,800 |
Source: Public Records
Tax History Compared to Growth
Tax History
| Year | Tax Paid | Tax Assessment Tax Assessment Total Assessment is a certain percentage of the fair market value that is determined by local assessors to be the total taxable value of land and additions on the property. | Land | Improvement |
|---|---|---|---|---|
| 2025 | $3,299 | $237,700 | $92,100 | $145,600 |
| 2024 | $3,235 | $237,700 | $92,100 | $145,600 |
| 2023 | $3,221 | $170,400 | $63,500 | $106,900 |
| 2022 | $3,154 | $170,400 | $63,500 | $106,900 |
| 2021 | $3,067 | $170,400 | $63,500 | $106,900 |
| 2020 | $2,929 | $141,000 | $60,300 | $80,700 |
| 2019 | $2,929 | $141,000 | $60,300 | $80,700 |
| 2018 | $2,861 | $141,000 | $60,300 | $80,700 |
| 2017 | $2,585 | $112,700 | $44,500 | $68,200 |
| 2016 | $2,530 | $112,700 | $44,500 | $68,200 |
| 2015 | $2,530 | $112,700 | $44,500 | $68,200 |
| 2014 | $2,595 | $113,600 | $44,500 | $69,100 |
Source: Public Records
Map
Nearby Homes