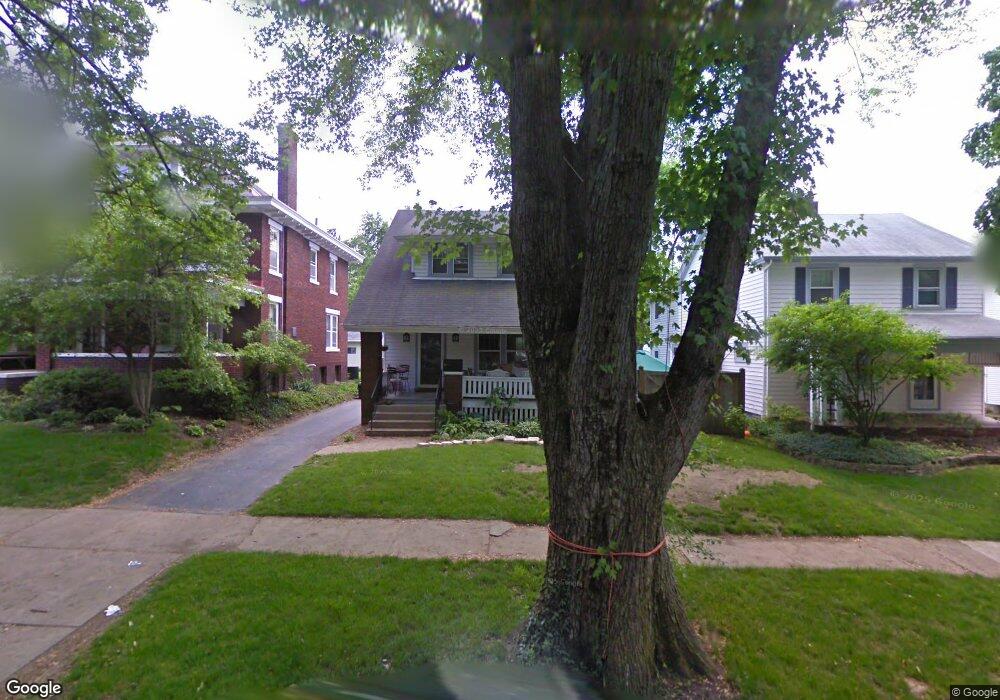
71 Blenheim Rd Columbus, OH 43214
Clintonville NeighborhoodEstimated Value: $361,000 - $424,000
3
Beds
1
Bath
1,354
Sq Ft
$297/Sq Ft
Est. Value
About This Home
This home is located at 71 Blenheim Rd, Columbus, OH 43214 and is currently estimated at $402,118, approximately $296 per square foot. 71 Blenheim Rd is a home located in Franklin County with nearby schools including Indian Springs Elementary School, Dominion Middle School, and Whetstone High School.
Ownership History
Date
Name
Owned For
Owner Type
Purchase Details
Closed on
Oct 14, 2011
Sold by
Carmean Thomas M
Bought by
Hausser Kristine S and Cecelia Carmean Irrevocable Tr
Current Estimated Value
Purchase Details
Closed on
Jul 24, 1997
Sold by
Ann Clawson Stephen D and Ann Pamela
Bought by
Hausser Kristine S
Home Financials for this Owner
Home Financials are based on the most recent Mortgage that was taken out on this home.
Original Mortgage
$80,000
Interest Rate
7.81%
Purchase Details
Closed on
Jan 27, 1993
Purchase Details
Closed on
Oct 20, 1987
Create a Home Valuation Report for This Property
The Home Valuation Report is an in-depth analysis detailing your home's value as well as a comparison with similar homes in the area
Home Values in the Area
Average Home Value in this Area
Purchase History
| Date | Buyer | Sale Price | Title Company |
|---|---|---|---|
| Hausser Kristine S | -- | Attorney | |
| Hausser Kristine S | $130,000 | Title First Agency Inc | |
| -- | $100,000 | -- | |
| -- | $69,000 | -- |
Source: Public Records
Mortgage History
| Date | Status | Borrower | Loan Amount |
|---|---|---|---|
| Open | Hausser Kristine S | $33,000 | |
| Open | Hausser Kristine S | $50,000 | |
| Closed | Hausser Kristine Ss | $50,000 | |
| Closed | Hausser Kristine S | $28,100 | |
| Closed | Hausser Kristine G | $50,000 | |
| Closed | Hausser Kristine S | $29,000 | |
| Previous Owner | Hausser Kristine S | $67,700 | |
| Previous Owner | Hausser Kristine S | $11,000 | |
| Previous Owner | Hausser Kristine S | $11,000 | |
| Previous Owner | Hausser Kristine S | $80,000 |
Source: Public Records
Tax History Compared to Growth
Tax History
| Year | Tax Paid | Tax Assessment Tax Assessment Total Assessment is a certain percentage of the fair market value that is determined by local assessors to be the total taxable value of land and additions on the property. | Land | Improvement |
|---|---|---|---|---|
| 2024 | $5,175 | $115,300 | $53,520 | $61,780 |
| 2023 | $5,109 | $115,290 | $53,515 | $61,775 |
| 2022 | $6,038 | $116,420 | $34,900 | $81,520 |
| 2021 | $6,049 | $116,420 | $34,900 | $81,520 |
| 2020 | $6,057 | $116,420 | $34,900 | $81,520 |
| 2019 | $5,462 | $90,030 | $26,850 | $63,180 |
| 2018 | $4,908 | $90,030 | $26,850 | $63,180 |
| 2017 | $5,458 | $90,030 | $26,850 | $63,180 |
| 2016 | $4,809 | $72,600 | $29,930 | $42,670 |
| 2015 | $4,366 | $72,600 | $29,930 | $42,670 |
| 2014 | $4,376 | $72,600 | $29,930 | $42,670 |
| 2013 | $2,105 | $69,125 | $28,490 | $40,635 |
Source: Public Records
Map
Nearby Homes
- 128 Blenheim Rd
- 3726 N High St
- 217 Arden Rd
- 340 Canyon Dr S
- 197 E Cooke Rd
- 220 Ceramic Dr
- 374 Acton Rd
- 221 Deland Ave
- 49 W Henderson Rd
- 88 W Kenworth Rd
- 111 W Henderson Rd
- 541 Northridge Rd
- 4415 Aldrich Place
- 4464 Zeller Rd
- 540 Fallis Rd
- 238 W Henderson Rd
- 36 Brighton Rd
- 685 Yaronia Dr N
- 4466 Olentangy Blvd
- 4299 Colerain Ave
- 75 Blenheim Rd
- 61 Blenheim Rd
- 81 Blenheim Rd
- 55 Blenheim Rd
- 60 Northridge Rd
- 66 Northridge Rd
- 54 Northridge Rd
- 87 Blenheim Rd
- 49 Blenheim Rd
- 72 Northridge Rd
- 46 Northridge Rd
- 74 Blenheim Rd
- 64 Blenheim Rd
- 95 Blenheim Rd
- 80 Northridge Rd
- 40 Northridge Rd
- 43 Blenheim Rd
- 82 Blenheim Rd
- 60 Blenheim Rd
- 86 Northridge Rd