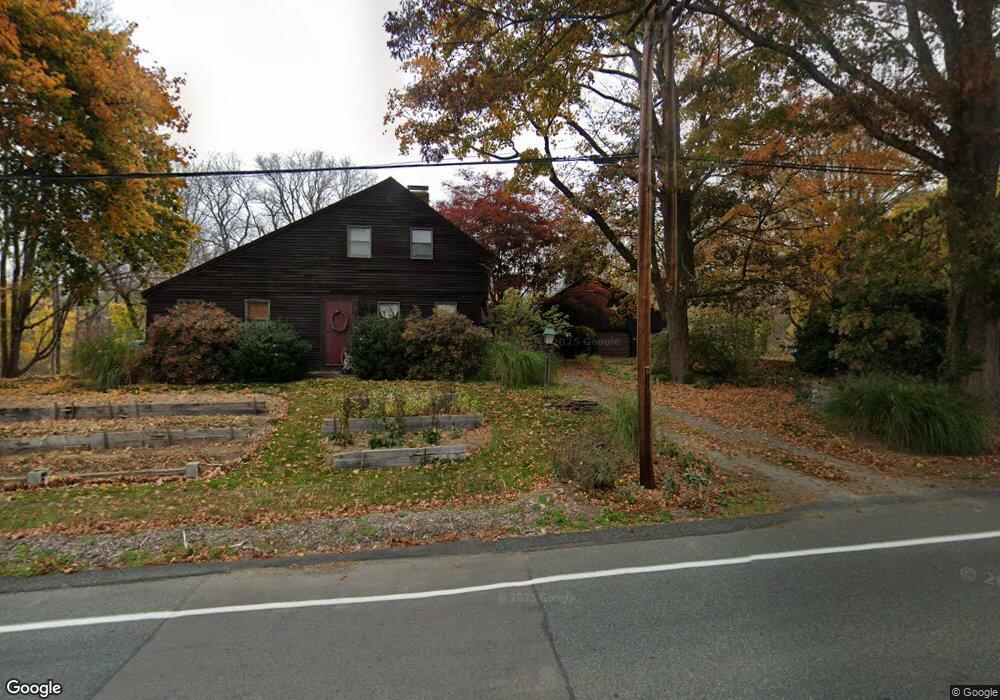
71 Bridge St West Newbury, MA 01985
Estimated Value: $819,000 - $939,000
4
Beds
2
Baths
2,142
Sq Ft
$418/Sq Ft
Est. Value
About This Home
This home is located at 71 Bridge St, West Newbury, MA 01985 and is currently estimated at $895,462, approximately $418 per square foot. 71 Bridge St is a home located in Essex County with nearby schools including Pentucket Regional High School.
Ownership History
Date
Name
Owned For
Owner Type
Purchase Details
Closed on
Mar 3, 2025
Sold by
Reed Wendy J
Bought by
Wendy J Reed Ft and Reed
Current Estimated Value
Purchase Details
Closed on
May 24, 2005
Sold by
Boone Daniel A and Reed Wendy J
Bought by
Reed Wendy J
Purchase Details
Closed on
May 1, 1995
Sold by
Schultz Thomas C and Schultz Pauline M
Bought by
Boone Daniel A and Reed Wendy J
Create a Home Valuation Report for This Property
The Home Valuation Report is an in-depth analysis detailing your home's value as well as a comparison with similar homes in the area
Home Values in the Area
Average Home Value in this Area
Purchase History
| Date | Buyer | Sale Price | Title Company |
|---|---|---|---|
| Wendy J Reed Ft | -- | None Available | |
| Wendy J Reed Ft | -- | None Available | |
| Reed Wendy J | -- | -- | |
| Reed Wendy J | -- | -- | |
| Boone Daniel A | $279,000 | -- | |
| Boone Daniel A | $279,000 | -- |
Source: Public Records
Mortgage History
| Date | Status | Borrower | Loan Amount |
|---|---|---|---|
| Previous Owner | Boone Daniel A | $106,235 | |
| Previous Owner | Boone Daniel A | $50,000 |
Source: Public Records
Tax History Compared to Growth
Tax History
| Year | Tax Paid | Tax Assessment Tax Assessment Total Assessment is a certain percentage of the fair market value that is determined by local assessors to be the total taxable value of land and additions on the property. | Land | Improvement |
|---|---|---|---|---|
| 2025 | $8,992 | $832,600 | $370,500 | $462,100 |
| 2024 | $7,928 | $732,700 | $346,900 | $385,800 |
| 2023 | $7,514 | $681,200 | $321,100 | $360,100 |
| 2022 | $7,345 | $564,600 | $251,800 | $312,800 |
| 2021 | $7,282 | $489,400 | $231,700 | $257,700 |
| 2020 | $6,997 | $485,200 | $231,700 | $253,500 |
| 2019 | $6,922 | $475,100 | $221,600 | $253,500 |
| 2018 | $6,556 | $450,300 | $211,500 | $238,800 |
| 2017 | $6,406 | $440,300 | $201,500 | $238,800 |
| 2016 | $6,294 | $430,200 | $191,400 | $238,800 |
| 2015 | $6,246 | $398,100 | $177,300 | $220,800 |
Source: Public Records
Map
Nearby Homes