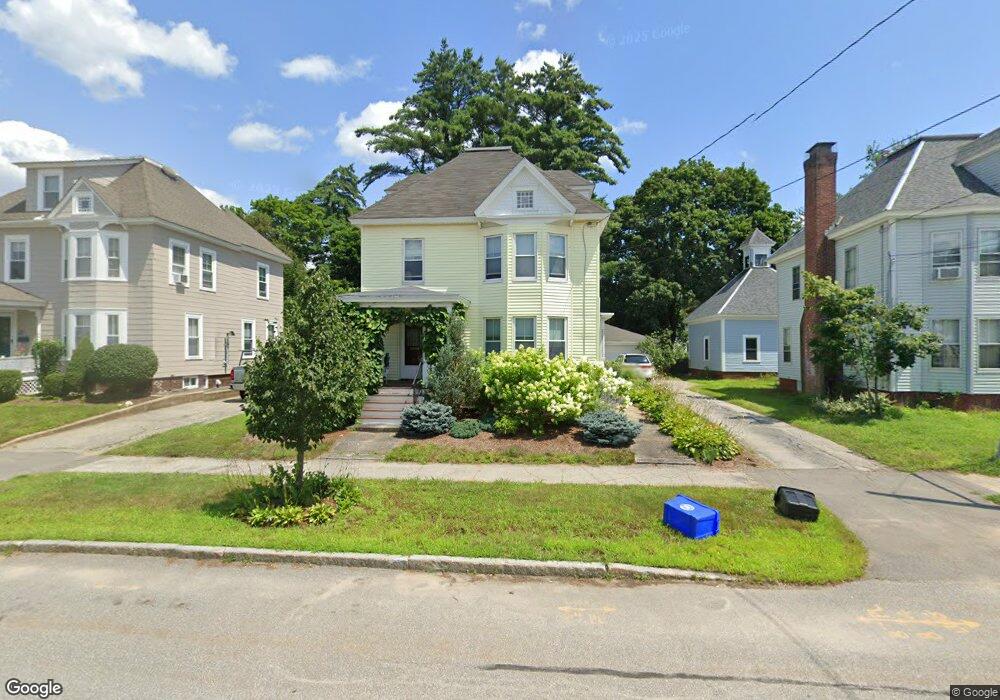
71 Broadway Concord, NH 03301
South End NeighborhoodEstimated Value: $470,419 - $579,000
3
Beds
2
Baths
2,025
Sq Ft
$260/Sq Ft
Est. Value
About This Home
This home is located at 71 Broadway, Concord, NH 03301 and is currently estimated at $525,605, approximately $259 per square foot. 71 Broadway is a home located in Merrimack County with nearby schools including Abbot-Downing School, Rundlett Middle School, and Concord High School.
Ownership History
Date
Name
Owned For
Owner Type
Purchase Details
Closed on
Nov 30, 2022
Sold by
Diers Theodore E and Diers Kerrie L
Bought by
Diers Ft 2001
Current Estimated Value
Purchase Details
Closed on
Apr 30, 2003
Sold by
Pearson John C
Bought by
Diers Theodore E and Diers Kerrie L
Home Financials for this Owner
Home Financials are based on the most recent Mortgage that was taken out on this home.
Original Mortgage
$199,900
Interest Rate
5.82%
Mortgage Type
Purchase Money Mortgage
Create a Home Valuation Report for This Property
The Home Valuation Report is an in-depth analysis detailing your home's value as well as a comparison with similar homes in the area
Home Values in the Area
Average Home Value in this Area
Purchase History
| Date | Buyer | Sale Price | Title Company |
|---|---|---|---|
| Diers Ft 2001 | -- | None Available | |
| Diers Theodore E | $249,900 | -- |
Source: Public Records
Mortgage History
| Date | Status | Borrower | Loan Amount |
|---|---|---|---|
| Previous Owner | Diers Theodore E | $207,400 | |
| Previous Owner | Diers Theodore E | $181,423 | |
| Previous Owner | Diers Theodore E | $199,900 |
Source: Public Records
Tax History Compared to Growth
Tax History
| Year | Tax Paid | Tax Assessment Tax Assessment Total Assessment is a certain percentage of the fair market value that is determined by local assessors to be the total taxable value of land and additions on the property. | Land | Improvement |
|---|---|---|---|---|
| 2024 | $8,858 | $319,900 | $108,600 | $211,300 |
| 2023 | $8,593 | $319,900 | $108,600 | $211,300 |
| 2022 | $8,282 | $319,900 | $108,600 | $211,300 |
| 2021 | $8,036 | $319,900 | $108,600 | $211,300 |
| 2020 | $7,870 | $294,100 | $86,500 | $207,600 |
| 2019 | $7,342 | $264,300 | $84,800 | $179,500 |
| 2018 | $7,138 | $253,200 | $84,800 | $168,400 |
| 2017 | $6,820 | $241,500 | $84,800 | $156,700 |
| 2016 | $6,478 | $234,100 | $83,300 | $150,800 |
| 2015 | $6,135 | $221,300 | $86,900 | $134,400 |
| 2014 | $5,933 | $221,300 | $86,900 | $134,400 |
| 2013 | -- | $221,300 | $86,900 | $134,400 |
| 2012 | -- | $226,300 | $86,900 | $139,400 |
Source: Public Records
Map
Nearby Homes
- 105 S Main St
- 122 South St
- 33 Spruce St
- 0 South St Unit 4969509
- 24 Badger St
- 0 Spruce St Unit 88
- 12 Avon St
- 14 Downing St
- 15 Wilson Ave
- 47 South St
- 22 Wilson Ave
- 14-16 Perley St
- 10 Perley St
- 376 S Main St
- 87 S Main St Unit 2
- 289 South St
- 4 Fayette St
- 22 Longmeadow Dr
- 54 Pleasant St Unit 8
- 41 Longmeadow Dr