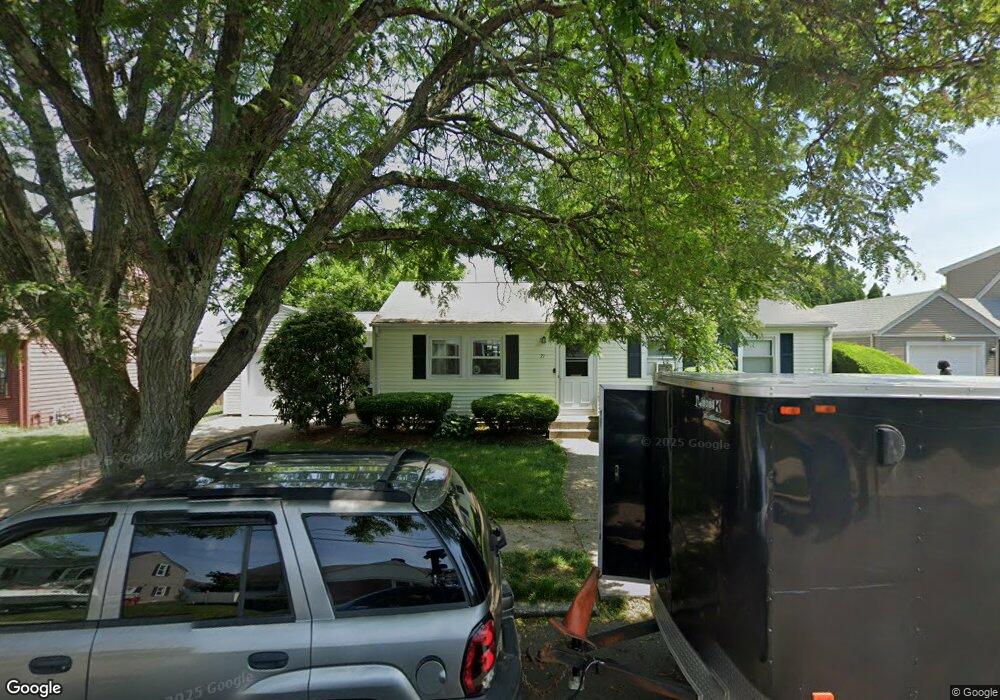
71 Bryant Rd Cranston, RI 02910
Eden Park NeighborhoodEstimated Value: $347,000 - $371,000
2
Beds
1
Bath
960
Sq Ft
$377/Sq Ft
Est. Value
About This Home
This home is located at 71 Bryant Rd, Cranston, RI 02910 and is currently estimated at $361,930, approximately $377 per square foot. 71 Bryant Rd is a home located in Providence County with nearby schools including Park View Middle School, Cranston High School East, and Cadence Academy Preschool - Cranston.
Ownership History
Date
Name
Owned For
Owner Type
Purchase Details
Closed on
Oct 15, 2025
Sold by
Parmenter Jeanne M
Bought by
Sosa Ana G and Leonard Matthew H
Current Estimated Value
Home Financials for this Owner
Home Financials are based on the most recent Mortgage that was taken out on this home.
Original Mortgage
$356,960
Outstanding Balance
$355,987
Interest Rate
6.5%
Mortgage Type
Purchase Money Mortgage
Estimated Equity
$5,943
Create a Home Valuation Report for This Property
The Home Valuation Report is an in-depth analysis detailing your home's value as well as a comparison with similar homes in the area
Home Values in the Area
Average Home Value in this Area
Purchase History
| Date | Buyer | Sale Price | Title Company |
|---|---|---|---|
| Sosa Ana G | $368,000 | -- |
Source: Public Records
Mortgage History
| Date | Status | Borrower | Loan Amount |
|---|---|---|---|
| Open | Sosa Ana G | $356,960 |
Source: Public Records
Tax History
| Year | Tax Paid | Tax Assessment Tax Assessment Total Assessment is a certain percentage of the fair market value that is determined by local assessors to be the total taxable value of land and additions on the property. | Land | Improvement |
|---|---|---|---|---|
| 2025 | $4,122 | $297,000 | $108,500 | $188,500 |
| 2024 | $4,042 | $297,000 | $108,500 | $188,500 |
| 2023 | $4,052 | $214,400 | $71,400 | $143,000 |
| 2022 | $3,969 | $214,400 | $71,400 | $143,000 |
| 2021 | $3,859 | $214,400 | $71,400 | $143,000 |
| 2020 | $3,656 | $176,000 | $68,000 | $108,000 |
| 2019 | $3,656 | $176,000 | $68,000 | $108,000 |
| 2018 | $3,571 | $176,000 | $68,000 | $108,000 |
| 2017 | $3,498 | $152,500 | $61,200 | $91,300 |
| 2016 | $3,424 | $152,500 | $61,200 | $91,300 |
| 2015 | $3,424 | $152,500 | $61,200 | $91,300 |
| 2014 | $3,428 | $150,100 | $61,200 | $88,900 |
Source: Public Records
Map
Nearby Homes
Your Personal Tour Guide
Ask me questions while you tour the home.