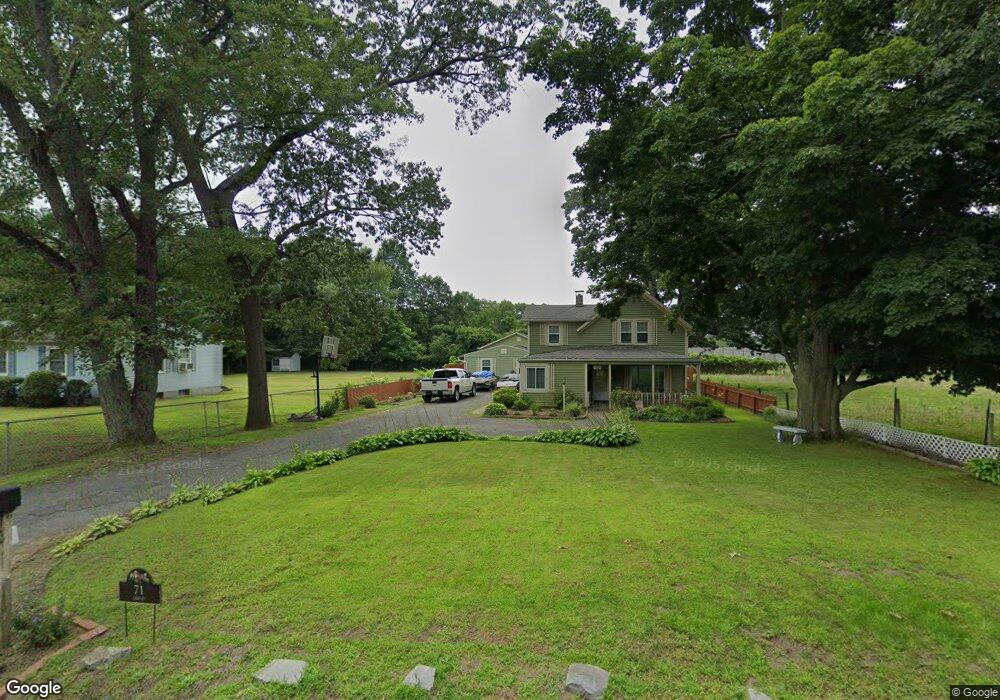
71 Cady St Ludlow, MA 01056
Estimated Value: $415,000 - $519,000
6
Beds
3
Baths
3,160
Sq Ft
$149/Sq Ft
Est. Value
About This Home
This home is located at 71 Cady St, Ludlow, MA 01056 and is currently estimated at $470,834, approximately $148 per square foot. 71 Cady St is a home located in Hampden County with nearby schools including East Street Elementary School, Chapin Street Elementary School, and Paul R. Baird Middle School.
Ownership History
Date
Name
Owned For
Owner Type
Purchase Details
Closed on
Jun 8, 2001
Sold by
Flebotte Joseph R and Flebotte Judith A
Bought by
Charow Raymond J and Charow Cathleen A
Current Estimated Value
Home Financials for this Owner
Home Financials are based on the most recent Mortgage that was taken out on this home.
Original Mortgage
$118,750
Interest Rate
7.08%
Mortgage Type
Purchase Money Mortgage
Create a Home Valuation Report for This Property
The Home Valuation Report is an in-depth analysis detailing your home's value as well as a comparison with similar homes in the area
Home Values in the Area
Average Home Value in this Area
Purchase History
| Date | Buyer | Sale Price | Title Company |
|---|---|---|---|
| Charow Raymond J | $125,000 | -- | |
| Charow Raymond J | $125,000 | -- |
Source: Public Records
Mortgage History
| Date | Status | Borrower | Loan Amount |
|---|---|---|---|
| Open | Charow Raymond J | $159,000 | |
| Closed | Charow Raymond J | $118,750 |
Source: Public Records
Tax History Compared to Growth
Tax History
| Year | Tax Paid | Tax Assessment Tax Assessment Total Assessment is a certain percentage of the fair market value that is determined by local assessors to be the total taxable value of land and additions on the property. | Land | Improvement |
|---|---|---|---|---|
| 2025 | $6,308 | $363,600 | $88,100 | $275,500 |
| 2024 | $5,972 | $330,100 | $87,900 | $242,200 |
| 2023 | $5,857 | $300,200 | $80,500 | $219,700 |
| 2022 | $5,249 | $262,600 | $73,800 | $188,800 |
| 2021 | $5,249 | $249,000 | $73,800 | $175,200 |
| 2020 | $5,025 | $243,700 | $72,700 | $171,000 |
| 2019 | $4,777 | $241,000 | $72,000 | $169,000 |
| 2018 | $4,469 | $235,100 | $72,000 | $163,100 |
| 2017 | $4,303 | $232,200 | $70,600 | $161,600 |
| 2016 | $4,077 | $224,900 | $69,200 | $155,700 |
| 2015 | $3,823 | $221,100 | $68,400 | $152,700 |
Source: Public Records
Map
Nearby Homes
- 0 Fuller St Unit 73409741
- 295 Main St
- 70 Fuller St
- 81-83 Motyka St
- 201 Main St
- 166-168 Main St
- 98 Fuller St Unit 32
- 59 Pinevale St
- 63 Pinevale St
- 61 Massachusetts Ave
- 1200 Worcester St
- 23 Daisy Ln
- 96 Lyons St
- 50 Warsaw Ave
- 32 White St
- 13-15 Decatur St
- 42 Loopley St
- 0 Center St Unit 73415933
- 34-36 Mazarin St
- 24 Elm St