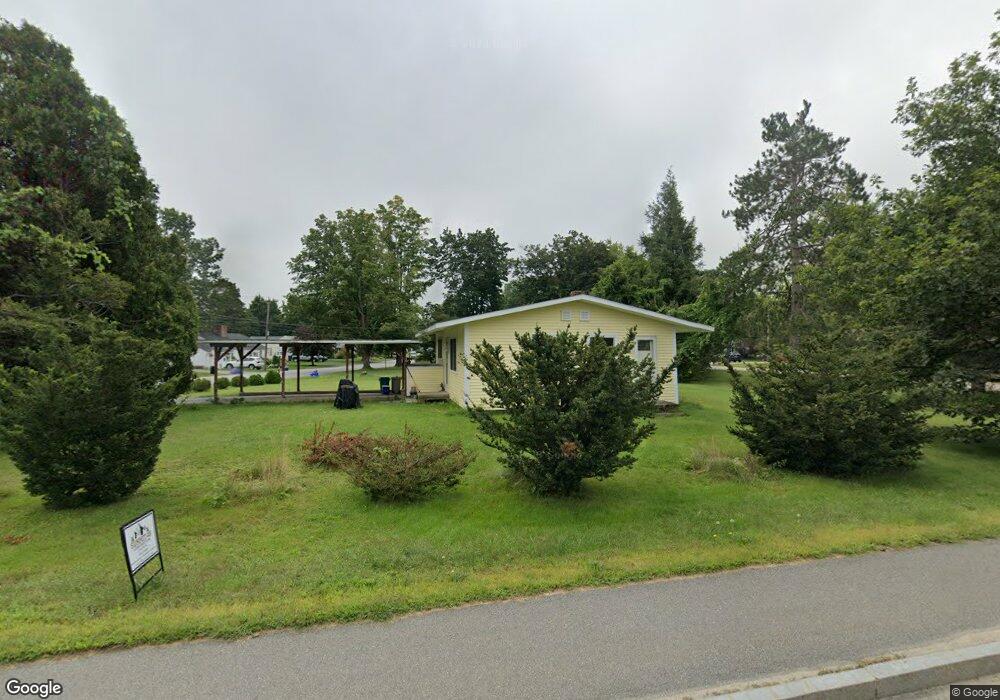
71 Clinton St Concord, NH 03301
South End NeighborhoodEstimated Value: $353,000 - $403,000
2
Beds
1
Bath
825
Sq Ft
$461/Sq Ft
Est. Value
About This Home
This home is located at 71 Clinton St, Concord, NH 03301 and is currently estimated at $380,207, approximately $460 per square foot. 71 Clinton St is a home located in Merrimack County with nearby schools including Abbot-Downing School, Rundlett Middle School, and Concord High School.
Ownership History
Date
Name
Owned For
Owner Type
Purchase Details
Closed on
Sep 25, 2001
Sold by
Haney Robert J
Bought by
Hundley Hope
Current Estimated Value
Home Financials for this Owner
Home Financials are based on the most recent Mortgage that was taken out on this home.
Original Mortgage
$86,400
Outstanding Balance
$34,042
Interest Rate
6.98%
Mortgage Type
Purchase Money Mortgage
Estimated Equity
$346,165
Create a Home Valuation Report for This Property
The Home Valuation Report is an in-depth analysis detailing your home's value as well as a comparison with similar homes in the area
Home Values in the Area
Average Home Value in this Area
Purchase History
| Date | Buyer | Sale Price | Title Company |
|---|---|---|---|
| Hundley Hope | $123,500 | -- |
Source: Public Records
Mortgage History
| Date | Status | Borrower | Loan Amount |
|---|---|---|---|
| Open | Hundley Hope | $86,400 |
Source: Public Records
Tax History Compared to Growth
Tax History
| Year | Tax Paid | Tax Assessment Tax Assessment Total Assessment is a certain percentage of the fair market value that is determined by local assessors to be the total taxable value of land and additions on the property. | Land | Improvement |
|---|---|---|---|---|
| 2024 | $6,291 | $227,200 | $110,300 | $116,900 |
| 2023 | $6,154 | $229,100 | $110,300 | $118,800 |
| 2022 | $5,931 | $229,100 | $110,300 | $118,800 |
| 2021 | $5,740 | $228,500 | $111,000 | $117,500 |
| 2020 | $5,403 | $201,900 | $88,600 | $113,300 |
| 2019 | $5,017 | $180,600 | $84,900 | $95,700 |
| 2018 | $4,773 | $169,300 | $81,500 | $87,800 |
| 2017 | $4,614 | $163,400 | $81,500 | $81,900 |
| 2016 | $4,358 | $157,500 | $79,900 | $77,600 |
| 2015 | $4,128 | $151,700 | $86,700 | $65,000 |
| 2014 | $4,067 | $151,700 | $86,700 | $65,000 |
| 2013 | -- | $150,000 | $86,700 | $63,300 |
| 2012 | -- | $146,400 | $86,700 | $59,700 |
Source: Public Records
Map
Nearby Homes
- 32 Carter St
- 0 South St Unit 4969509
- 2 Kensington Rd
- 1 Kensington Rd
- 11 Pleasant View Ave
- 0 Spruce St Unit 88
- 33 Spruce St
- 24 Badger St
- 7 Lincoln St
- 8 Wood Ave
- 105 S Main St
- 14 Downing St
- 73 Warren St Unit 3
- 25 Fayette St
- 10 Perley St
- 87 S Main St Unit 2
- 376 S Main St
- 289 South St
- 10 N State St
- 83 Rumford St
- 4 Springfield St
- 3 Springfield St
- 69 Clinton St
- 5 Springfield St
- 7 Springfield St
- 64 Noyes St
- 8 Springfield St
- 65 Noyes St
- 67 Clinton St
- 9 Springfield St
- 7 Norwich St
- 10 Springfield St
- 62 Noyes St
- 65 Clinton St
- 9 Norwich St
- 11 Springfield St
- 63 Noyes St
- 12 Springfield St
- 11 Norwich St
- 13 Springfield St