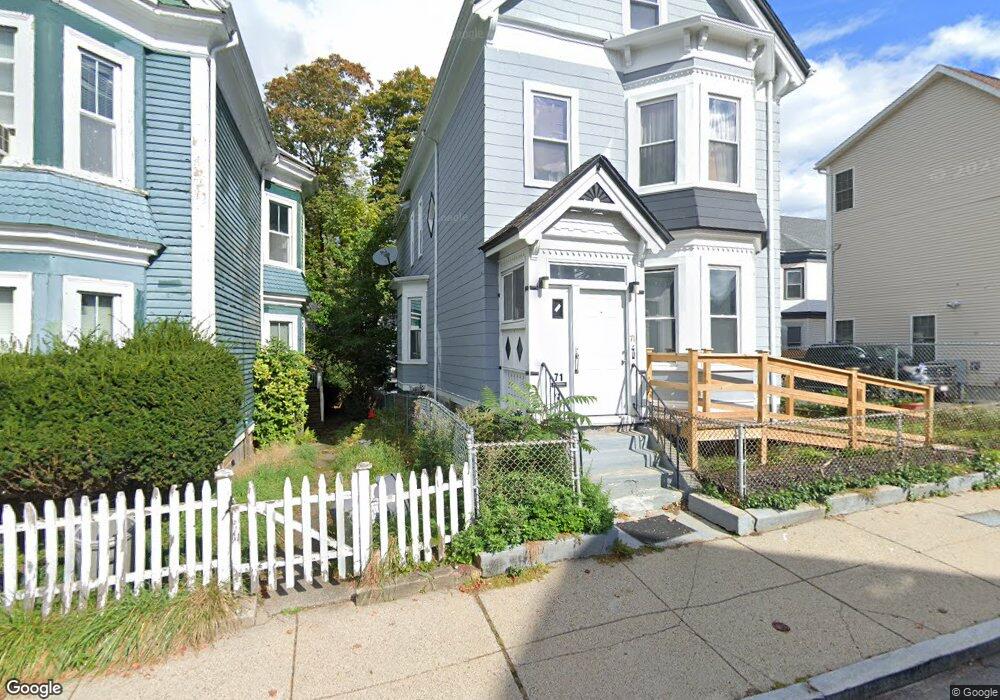
71 Dale St Roxbury, MA 02119
Washington Park NeighborhoodEstimated Value: $672,075 - $927,000
2
Beds
2
Baths
2,644
Sq Ft
$292/Sq Ft
Est. Value
About This Home
This home is located at 71 Dale St, Roxbury, MA 02119 and is currently estimated at $772,269, approximately $292 per square foot. 71 Dale St is a home located in Suffolk County with nearby schools including Bridge Boston Charter School and City on a Hill Charter Public School.
Ownership History
Date
Name
Owned For
Owner Type
Purchase Details
Closed on
Feb 25, 2013
Sold by
Stubbs Joan
Bought by
Stubbs Joan G and Stubbs Glen A
Current Estimated Value
Home Financials for this Owner
Home Financials are based on the most recent Mortgage that was taken out on this home.
Original Mortgage
$200,000
Outstanding Balance
$138,530
Interest Rate
3.44%
Mortgage Type
New Conventional
Estimated Equity
$633,739
Create a Home Valuation Report for This Property
The Home Valuation Report is an in-depth analysis detailing your home's value as well as a comparison with similar homes in the area
Home Values in the Area
Average Home Value in this Area
Purchase History
| Date | Buyer | Sale Price | Title Company |
|---|---|---|---|
| Stubbs Joan G | -- | -- |
Source: Public Records
Mortgage History
| Date | Status | Borrower | Loan Amount |
|---|---|---|---|
| Open | Stubbs Joan G | $200,000 |
Source: Public Records
Tax History
| Year | Tax Paid | Tax Assessment Tax Assessment Total Assessment is a certain percentage of the fair market value that is determined by local assessors to be the total taxable value of land and additions on the property. | Land | Improvement |
|---|---|---|---|---|
| 2025 | $6,097 | $526,500 | $180,000 | $346,500 |
| 2024 | $5,417 | $497,000 | $166,700 | $330,300 |
| 2023 | $5,338 | $497,000 | $166,700 | $330,300 |
| 2022 | $5,056 | $464,700 | $155,900 | $308,800 |
| 2021 | $4,744 | $444,600 | $152,800 | $291,800 |
| 2020 | $4,122 | $390,300 | $146,200 | $244,100 |
| 2019 | $3,836 | $363,900 | $126,600 | $237,300 |
| 2018 | $3,563 | $340,000 | $126,600 | $213,400 |
| 2017 | $3,494 | $329,900 | $126,600 | $203,300 |
| 2016 | $3,456 | $314,200 | $126,600 | $187,600 |
| 2015 | $2,926 | $241,600 | $87,700 | $153,900 |
| 2014 | $2,951 | $234,600 | $87,700 | $146,900 |
Source: Public Records
Map
Nearby Homes
- 150 Walnut Ave
- 64 Alpine St Unit 104
- 64 Alpine St Unit 304
- 85 Munroe St
- 30 Copeland St Unit 1
- 9 W Cedar St
- 16 Mayfair St
- 33 Copeland St Unit C
- 22-22A Montrose St
- 76 Perrin St Unit 1
- 7 Langford Park Unit 1
- 7 Langford Park Unit 3
- 59 Perrin St Unit 3
- 59 Copeland St
- 27 Saint James St
- 151 Townsend St Unit 1
- 151 Townsend St Unit 3
- 151 Townsend St
- 151 Townsend St Unit 2
- 16 Hawthorne St
Your Personal Tour Guide
Ask me questions while you tour the home.