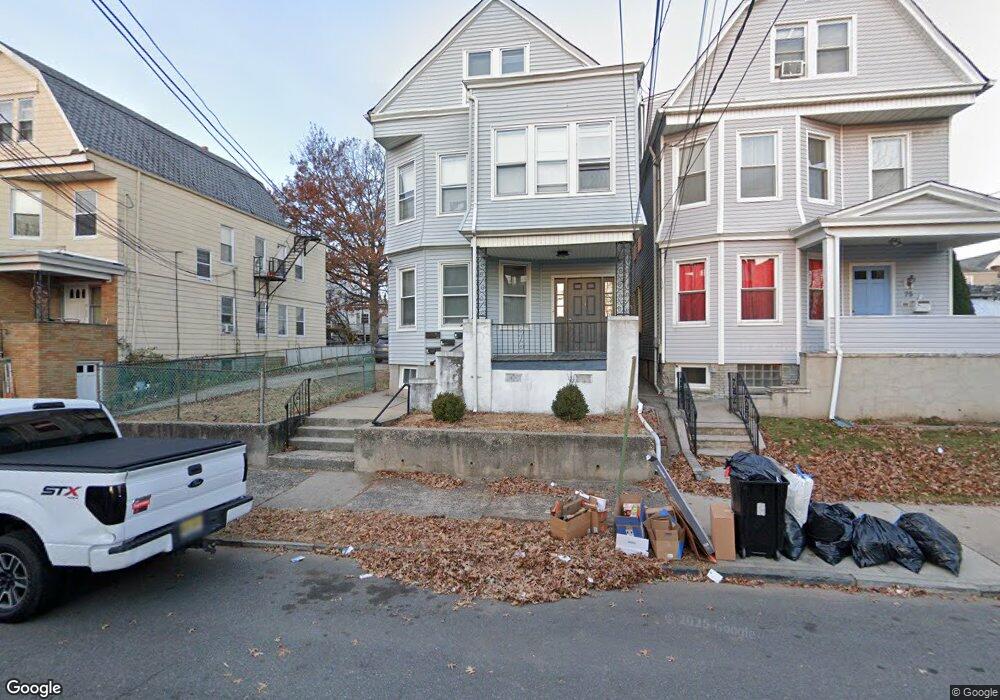
71 Elm St Unit 73 Kearny, NJ 07032
Estimated Value: $747,402 - $895,000
7
Beds
3
Baths
3,342
Sq Ft
$250/Sq Ft
Est. Value
About This Home
This home is located at 71 Elm St Unit 73, Kearny, NJ 07032 and is currently estimated at $837,101, approximately $250 per square foot. 71 Elm St Unit 73 is a home located in Hudson County with nearby schools including Kearny High School and Kearny Christian Academy.
Ownership History
Date
Name
Owned For
Owner Type
Purchase Details
Closed on
Dec 12, 2008
Sold by
Guardia Peter and Guardia Flores
Bought by
Villa John
Current Estimated Value
Home Financials for this Owner
Home Financials are based on the most recent Mortgage that was taken out on this home.
Original Mortgage
$303,750
Outstanding Balance
$197,787
Interest Rate
6.17%
Mortgage Type
New Conventional
Estimated Equity
$639,314
Purchase Details
Closed on
Jun 14, 2006
Sold by
Mcgowan Mary A
Bought by
Guardia Peter J and Flores Jackeline
Home Financials for this Owner
Home Financials are based on the most recent Mortgage that was taken out on this home.
Original Mortgage
$408,000
Interest Rate
6.67%
Mortgage Type
Purchase Money Mortgage
Create a Home Valuation Report for This Property
The Home Valuation Report is an in-depth analysis detailing your home's value as well as a comparison with similar homes in the area
Purchase History
| Date | Buyer | Sale Price | Title Company |
|---|---|---|---|
| Villa John | $405,000 | -- | |
| Guardia Peter J | $510,000 | Clear Advantage Title Inc |
Source: Public Records
Mortgage History
| Date | Status | Borrower | Loan Amount |
|---|---|---|---|
| Open | Villa John | $303,750 | |
| Previous Owner | Guardia Peter J | $408,000 |
Source: Public Records
Tax History
| Year | Tax Paid | Tax Assessment Tax Assessment Total Assessment is a certain percentage of the fair market value that is determined by local assessors to be the total taxable value of land and additions on the property. | Land | Improvement |
|---|---|---|---|---|
| 2025 | $14,345 | $134,000 | $35,000 | $99,000 |
| 2024 | $14,160 | $134,000 | $35,000 | $99,000 |
| 2023 | $14,160 | $134,000 | $35,000 | $99,000 |
| 2022 | $14,126 | $134,000 | $35,000 | $99,000 |
| 2021 | $14,050 | $134,000 | $35,000 | $99,000 |
| 2020 | $12,651 | $120,600 | $35,000 | $85,600 |
| 2019 | $12,714 | $120,600 | $35,000 | $85,600 |
| 2018 | $12,737 | $120,600 | $35,000 | $85,600 |
| 2017 | $12,910 | $120,600 | $35,000 | $85,600 |
| 2016 | $12,867 | $120,600 | $35,000 | $85,600 |
| 2015 | $12,453 | $120,600 | $35,000 | $85,600 |
| 2014 | $12,103 | $120,600 | $35,000 | $85,600 |
Source: Public Records
Map
Nearby Homes
- 204 Devon St
- 153 Devon St
- 53 Devon Terrace
- 201 Chestnut St
- 211 Bergen Ave
- 211 Bergen Ave Unit 2
- 88 Devon St
- 58 Wilson Ave
- 131 Dukes St
- 118 Maple St
- 89 Ivy St
- 206 Highland Ave
- 307 Kearny Ave
- 281 Maple St
- 84 Brighton Ave
- 251 Highland Ave
- 124 Belgrove Dr
- 416 Scott Mobus Place Unit 420
- 229 Patterson St
- 430 Central Ave
Your Personal Tour Guide
Ask me questions while you tour the home.