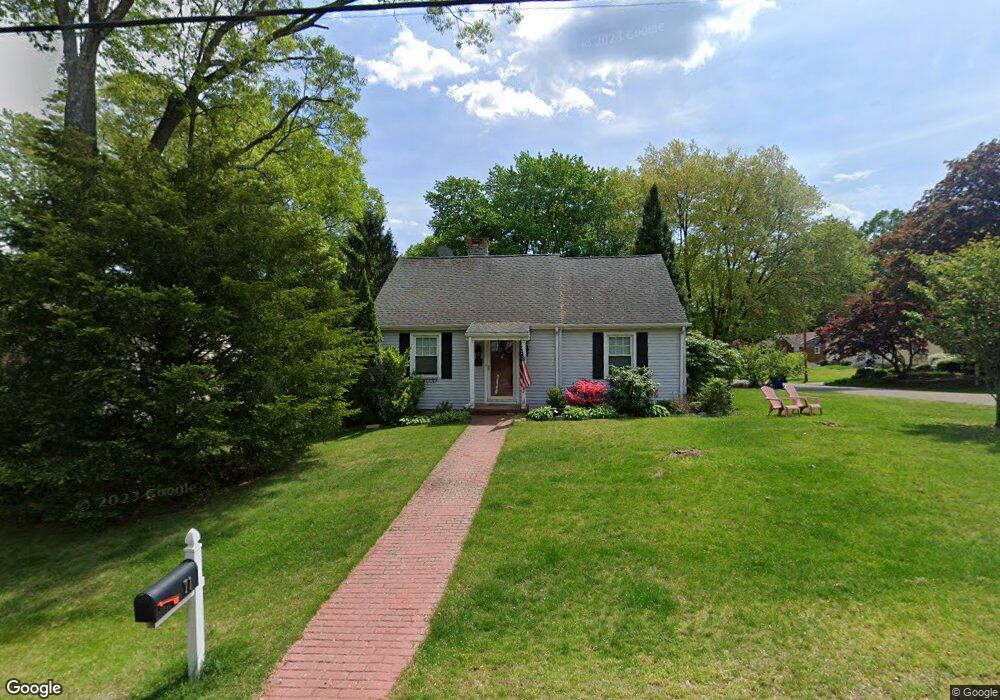
71 Evelyn St Trumbull, CT 06611
West Trumbull NeighborhoodEstimated Value: $606,132 - $765,000
3
Beds
2
Baths
1,570
Sq Ft
$422/Sq Ft
Est. Value
About This Home
This home is located at 71 Evelyn St, Trumbull, CT 06611 and is currently estimated at $662,283, approximately $421 per square foot. 71 Evelyn St is a home located in Fairfield County with nearby schools including Jane Ryan School, Madison Middle School, and Trumbull High School.
Ownership History
Date
Name
Owned For
Owner Type
Purchase Details
Closed on
May 15, 2009
Sold by
Defeo Marc J and Defeo Michelle A
Bought by
Citsay Noah and Watson-Citsay Megan
Current Estimated Value
Home Financials for this Owner
Home Financials are based on the most recent Mortgage that was taken out on this home.
Original Mortgage
$374,623
Interest Rate
4.85%
Purchase Details
Closed on
Sep 2, 2004
Sold by
Kachaluba John Paul
Bought by
Defen Marc J and Baker Michelle A
Home Financials for this Owner
Home Financials are based on the most recent Mortgage that was taken out on this home.
Original Mortgage
$333,000
Interest Rate
6.01%
Purchase Details
Closed on
Dec 13, 2000
Sold by
Marron Peter F and Marron Robin
Bought by
Kachaluba John P
Purchase Details
Closed on
Dec 29, 1992
Sold by
Cutterwr Christopher
Bought by
Marron Peter and Marron Robin
Create a Home Valuation Report for This Property
The Home Valuation Report is an in-depth analysis detailing your home's value as well as a comparison with similar homes in the area
Home Values in the Area
Average Home Value in this Area
Purchase History
| Date | Buyer | Sale Price | Title Company |
|---|---|---|---|
| Citsay Noah | $405,000 | -- | |
| Defen Marc J | $420,000 | -- | |
| Kachaluba John P | $261,000 | -- | |
| Marron Peter | $182,000 | -- |
Source: Public Records
Mortgage History
| Date | Status | Borrower | Loan Amount |
|---|---|---|---|
| Open | Marron Peter | $341,450 | |
| Closed | Marron Peter | $374,623 | |
| Previous Owner | Marron Peter | $333,000 |
Source: Public Records
Tax History
| Year | Tax Paid | Tax Assessment Tax Assessment Total Assessment is a certain percentage of the fair market value that is determined by local assessors to be the total taxable value of land and additions on the property. | Land | Improvement |
|---|---|---|---|---|
| 2025 | $9,844 | $267,890 | $142,310 | $125,580 |
| 2024 | $9,565 | $267,890 | $142,310 | $125,580 |
| 2023 | $9,413 | $267,890 | $142,310 | $125,580 |
| 2022 | $9,261 | $267,890 | $142,310 | $125,580 |
| 2021 | $8,183 | $225,050 | $118,580 | $106,470 |
| 2020 | $8,026 | $225,050 | $118,580 | $106,470 |
| 2018 | $7,847 | $225,050 | $118,580 | $106,470 |
| 2017 | $7,701 | $225,050 | $118,580 | $106,470 |
| 2016 | $7,503 | $225,050 | $118,580 | $106,470 |
| 2015 | $7,631 | $228,000 | $118,600 | $109,400 |
| 2014 | $7,469 | $228,000 | $118,600 | $109,400 |
Source: Public Records
Map
Nearby Homes
- 215 Fernwood Rd
- 40 Rose Terrace
- 10 Aragon Dr
- 75 Middlebrooks Ave
- 26 Grove St
- 21 Histon Rd
- 4487 Madison Ave
- 71 Cider Mill Ln
- Lot 31 Valley View Rd
- lot 194 Prospect Ave
- 0 Main St
- 546 Church Hill Rd
- 45 Frenchtown Rd
- 4725 Madison Ave
- 66 Loftus Cir
- 18 Ridgebury Dr
- 58 Daniels Farm Rd
- 132 Merrimac Dr
- 81 Lance Cir
- 877 White Plains Rd