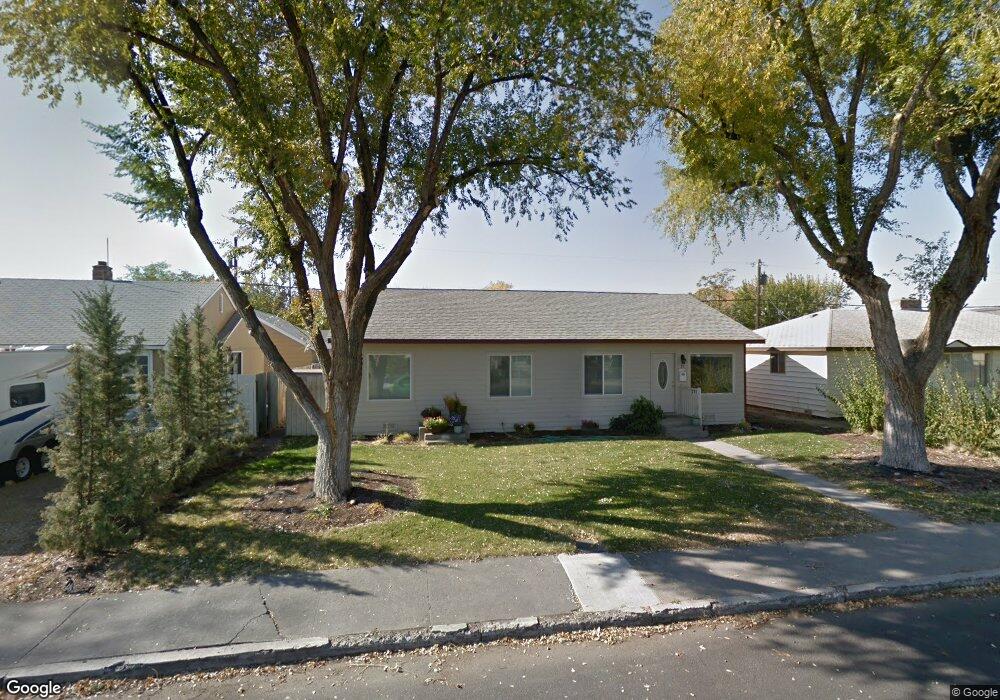
71 G St NE Ephrata, WA 98823
Estimated Value: $290,000 - $312,000
3
Beds
2
Baths
1,368
Sq Ft
$221/Sq Ft
Est. Value
About This Home
This home is located at 71 G St NE, Ephrata, WA 98823 and is currently estimated at $302,881, approximately $221 per square foot. 71 G St NE is a home located in Grant County with nearby schools including Ephrata High School, New Life Christian School, and St. Rose of Lima Catholic School.
Ownership History
Date
Name
Owned For
Owner Type
Purchase Details
Closed on
Feb 21, 2008
Sold by
Williams Linda Jo
Bought by
Bretches Jessica B and Bretches Ricky L
Current Estimated Value
Home Financials for this Owner
Home Financials are based on the most recent Mortgage that was taken out on this home.
Original Mortgage
$140,750
Outstanding Balance
$87,801
Interest Rate
5.85%
Mortgage Type
VA
Estimated Equity
$215,080
Purchase Details
Closed on
Oct 25, 1999
Sold by
Strnad Ronald J and Kruger Dorothea
Bought by
Williams Linda Jo
Create a Home Valuation Report for This Property
The Home Valuation Report is an in-depth analysis detailing your home's value as well as a comparison with similar homes in the area
Home Values in the Area
Average Home Value in this Area
Purchase History
| Date | Buyer | Sale Price | Title Company |
|---|---|---|---|
| Bretches Jessica B | $140,750 | Chicago Title Ins Co | |
| Williams Linda Jo | -- | Chicago Title Insurance Co |
Source: Public Records
Mortgage History
| Date | Status | Borrower | Loan Amount |
|---|---|---|---|
| Open | Bretches Jessica B | $140,750 |
Source: Public Records
Tax History Compared to Growth
Tax History
| Year | Tax Paid | Tax Assessment Tax Assessment Total Assessment is a certain percentage of the fair market value that is determined by local assessors to be the total taxable value of land and additions on the property. | Land | Improvement |
|---|---|---|---|---|
| 2024 | $2,660 | $235,930 | $23,500 | $212,430 |
| 2023 | $2,699 | $215,435 | $23,500 | $191,935 |
| 2022 | $2,683 | $215,435 | $23,500 | $191,935 |
| 2021 | $2,415 | $215,435 | $23,500 | $191,935 |
| 2020 | $2,309 | $184,710 | $23,500 | $161,210 |
| 2019 | $1,698 | $159,970 | $23,500 | $136,470 |
| 2018 | $2,301 | $158,925 | $20,000 | $138,925 |
| 2017 | $2,283 | $168,285 | $20,000 | $148,285 |
| 2016 | $2,286 | $156,235 | $20,000 | $136,235 |
| 2013 | -- | $159,210 | $20,000 | $139,210 |
Source: Public Records
Map
Nearby Homes