71 Gilbert St Warwick, RI 02886
Greenwood NeighborhoodEstimated Value: $410,472 - $449,000
3
Beds
1
Bath
1,212
Sq Ft
$355/Sq Ft
Est. Value
About This Home
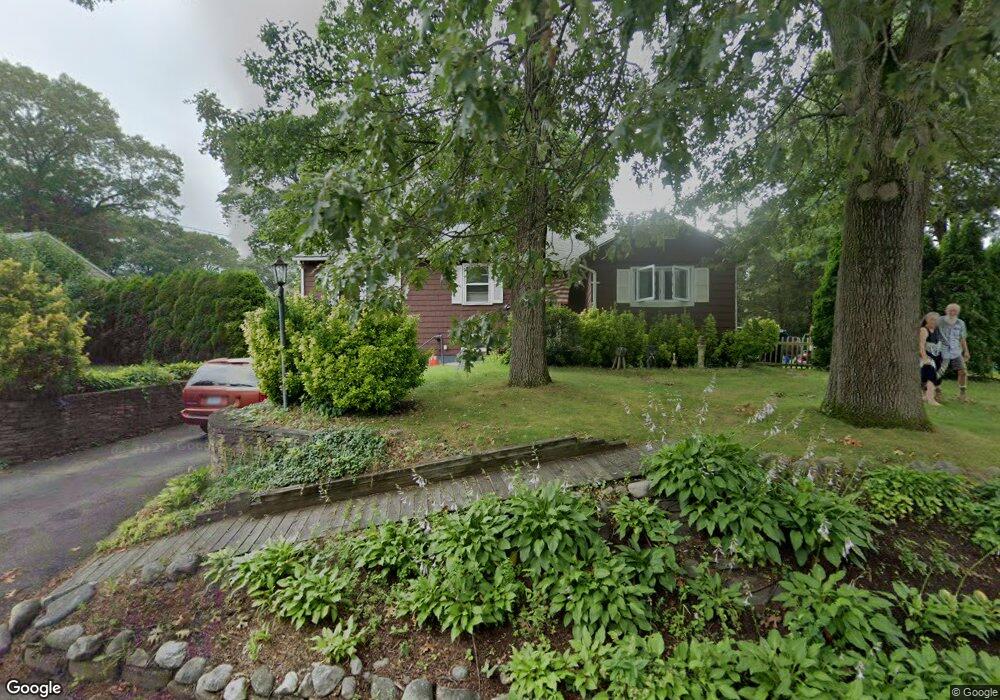
This home is located at 71 Gilbert St, Warwick, RI 02886 and is currently estimated at $429,868, approximately $354 per square foot. 71 Gilbert St is a home located in Kent County with nearby schools including St Rose Of Lima School and Eleanor Briggs School.
Ownership History
Date
Name
Owned For
Owner Type
Purchase Details
Closed on
Jun 2, 1989
Sold by
Benner John M
Bought by
Nixon Robert A
Current Estimated Value
Home Financials for this Owner
Home Financials are based on the most recent Mortgage that was taken out on this home.
Original Mortgage
$83,000
Interest Rate
10.92%
Mortgage Type
Purchase Money Mortgage
Create a Home Valuation Report for This Property
The Home Valuation Report is an in-depth analysis detailing your home's value as well as a comparison with similar homes in the area
Home Values in the Area
Average Home Value in this Area
Purchase History
| Date | Buyer | Sale Price | Title Company |
|---|---|---|---|
| Nixon Robert A | $112,000 | -- | |
| Nixon Robert A | $112,000 | -- |
Source: Public Records
Mortgage History
| Date | Status | Borrower | Loan Amount |
|---|---|---|---|
| Open | Nixon Robert A | $175,000 | |
| Closed | Nixon Robert A | $17,000 | |
| Closed | Nixon Robert A | $83,000 |
Source: Public Records
Tax History
| Year | Tax Paid | Tax Assessment Tax Assessment Total Assessment is a certain percentage of the fair market value that is determined by local assessors to be the total taxable value of land and additions on the property. | Land | Improvement |
|---|---|---|---|---|
| 2025 | $4,364 | $343,600 | $110,900 | $232,700 |
| 2024 | $4,231 | $292,400 | $96,400 | $196,000 |
| 2023 | $4,149 | $292,400 | $96,400 | $196,000 |
| 2022 | $4,175 | $222,900 | $75,600 | $147,300 |
| 2021 | $4,175 | $222,900 | $75,600 | $147,300 |
| 2020 | $4,175 | $222,900 | $75,600 | $147,300 |
| 2019 | $4,175 | $222,900 | $75,600 | $147,300 |
| 2018 | $3,528 | $169,600 | $68,700 | $100,900 |
| 2017 | $3,433 | $169,600 | $68,700 | $100,900 |
| 2016 | $3,433 | $169,600 | $68,700 | $100,900 |
| 2015 | $3,144 | $151,500 | $64,600 | $86,900 |
| 2014 | $3,039 | $151,500 | $64,600 | $86,900 |
| 2013 | $2,998 | $151,500 | $64,600 | $86,900 |
Source: Public Records
Map
Nearby Homes
- 36 Great Oak Dr
- 139 Lancaster Ave
- 27 Great Oak Dr
- 52 Benefit St
- 151 Drum Rock Ave
- 3399 Post Rd Unit 15
- 84 Spruce St
- 839 Greenwich Ave
- 2907 Post Rd Unit 6
- 2907 Post Rd Unit 4
- 2907 Post Rd Unit 2
- 2907 Post Rd Unit 8
- 2907 Post Rd Unit 3
- 333 Greenwood Ave
- 403 Commonwealth Ave
- 5 Barre Ct
- 3524 W Shore Road Building C-704 Rd Unit C-704
- 155 Birkshire Dr
- 157 George Arden Ave
- 237 Commonwealth Ave
Your Personal Tour Guide
Ask me questions while you tour the home.