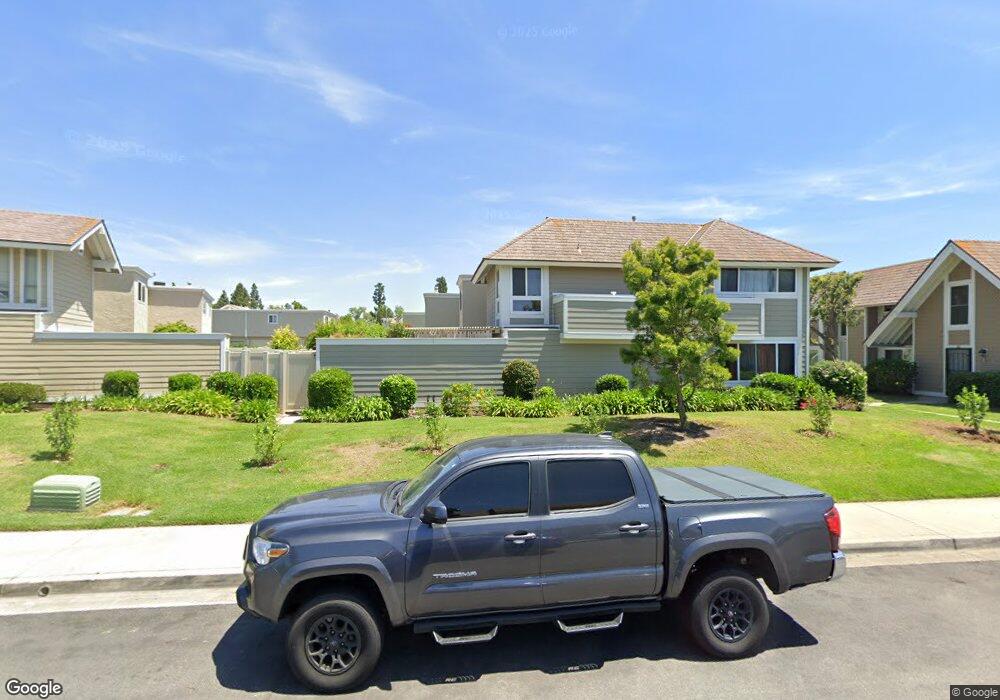
71 Golden Glen St Unit 1 Irvine, CA 92604
Walnut NeighborhoodEstimated Value: $739,753 - $869,000
2
Beds
2
Baths
1,048
Sq Ft
$768/Sq Ft
Est. Value
About This Home
This home is located at 71 Golden Glen St Unit 1, Irvine, CA 92604 and is currently estimated at $805,188, approximately $768 per square foot. 71 Golden Glen St Unit 1 is a home located in Orange County with nearby schools including Greentree Elementary School, Venado Middle School, and Irvine High School.
Ownership History
Date
Name
Owned For
Owner Type
Purchase Details
Closed on
Sep 27, 2019
Sold by
Pandit Vippul and Pandit Urmila
Bought by
Pandit Vippul and Pandit Urmila
Current Estimated Value
Purchase Details
Closed on
Apr 6, 2001
Sold by
Dunphy Julia and George Jennifer
Bought by
Pandit Vippul and Pandit Urmila
Home Financials for this Owner
Home Financials are based on the most recent Mortgage that was taken out on this home.
Original Mortgage
$154,000
Interest Rate
7.15%
Purchase Details
Closed on
Jan 21, 1994
Sold by
Salvi Barbara A
Bought by
George Julia R and George Jennifer
Home Financials for this Owner
Home Financials are based on the most recent Mortgage that was taken out on this home.
Original Mortgage
$130,950
Interest Rate
7%
Mortgage Type
FHA
Create a Home Valuation Report for This Property
The Home Valuation Report is an in-depth analysis detailing your home's value as well as a comparison with similar homes in the area
Home Values in the Area
Average Home Value in this Area
Purchase History
| Date | Buyer | Sale Price | Title Company |
|---|---|---|---|
| Pandit Vippul | -- | None Available | |
| Pandit Vippul | $192,500 | First Southwestern Title Co | |
| George Julia R | $135,500 | Commonwealth Land Title |
Source: Public Records
Mortgage History
| Date | Status | Borrower | Loan Amount |
|---|---|---|---|
| Previous Owner | Pandit Vippul | $154,000 | |
| Previous Owner | George Julia R | $130,950 | |
| Closed | Pandit Vippul | $19,200 |
Source: Public Records
Tax History Compared to Growth
Tax History
| Year | Tax Paid | Tax Assessment Tax Assessment Total Assessment is a certain percentage of the fair market value that is determined by local assessors to be the total taxable value of land and additions on the property. | Land | Improvement |
|---|---|---|---|---|
| 2025 | $3,059 | $290,057 | $205,274 | $84,783 |
| 2024 | $3,059 | $284,370 | $201,249 | $83,121 |
| 2023 | $2,978 | $278,795 | $197,303 | $81,492 |
| 2022 | $2,915 | $273,329 | $193,434 | $79,895 |
| 2021 | $2,844 | $267,970 | $189,641 | $78,329 |
| 2020 | $2,828 | $265,223 | $187,697 | $77,526 |
| 2019 | $2,764 | $260,023 | $184,017 | $76,006 |
| 2018 | $2,712 | $254,925 | $180,409 | $74,516 |
| 2017 | $2,655 | $249,927 | $176,872 | $73,055 |
| 2016 | $2,540 | $245,027 | $173,404 | $71,623 |
| 2015 | $2,448 | $241,347 | $170,799 | $70,548 |
| 2014 | $2,400 | $236,620 | $167,453 | $69,167 |
Source: Public Records
Map
Nearby Homes
- 45 Golden Glen St Unit 75
- 32 Kazan St Unit 18
- 5151 Walnut Ave Unit 34
- 14851 Jeffrey Rd Unit 199
- 14851 Jeffrey Rd Unit 350
- 14851 Jeffrey Rd Unit 248
- 14851 Jeffrey Rd Unit 61
- 14851 Jeffrey Rd Unit 334
- 14851 Jeffrey Rd Unit 352
- 14851 Jeffrey Rd Unit 25
- 14851 Jeffrey Rd Unit 145
- 14851 Jeffrey Rd Unit 246
- 10 Raleigh
- 14942 Dahlquist Rd
- 14612 Highcrest Cir
- 26 Helena Unit 69
- 4862 Gainsport Cir
- 15071 Talley St
- 115 Huntington
- 27 Cheyenne Unit 69
- 81 Golden Glen St
- 85 Golden Glen St Unit 3
- 87 Golden Glen St Unit 4
- 85 Golden Glen St
- 63 Golden Glen St Unit 2
- 67 Golden Glen St Unit 4
- 61 Golden Glen St
- 150 Oval Rd Unit 1
- 150 Oval Rd
- 51 Elksford Ave Unit 1
- 55 Elksford Ave Unit 3
- 166 Oval Rd Unit 4
- 160 Oval Rd Unit 1
- 60 Golden Glen St Unit 1
- 51 Golden Glen St Unit 1
- 51 Golden Glen St
- 57 Golden Glen St Unit 4
- 64 Golden Glen St Unit 3
- 130 Oval Rd Unit 1
- 130 Oval Rd