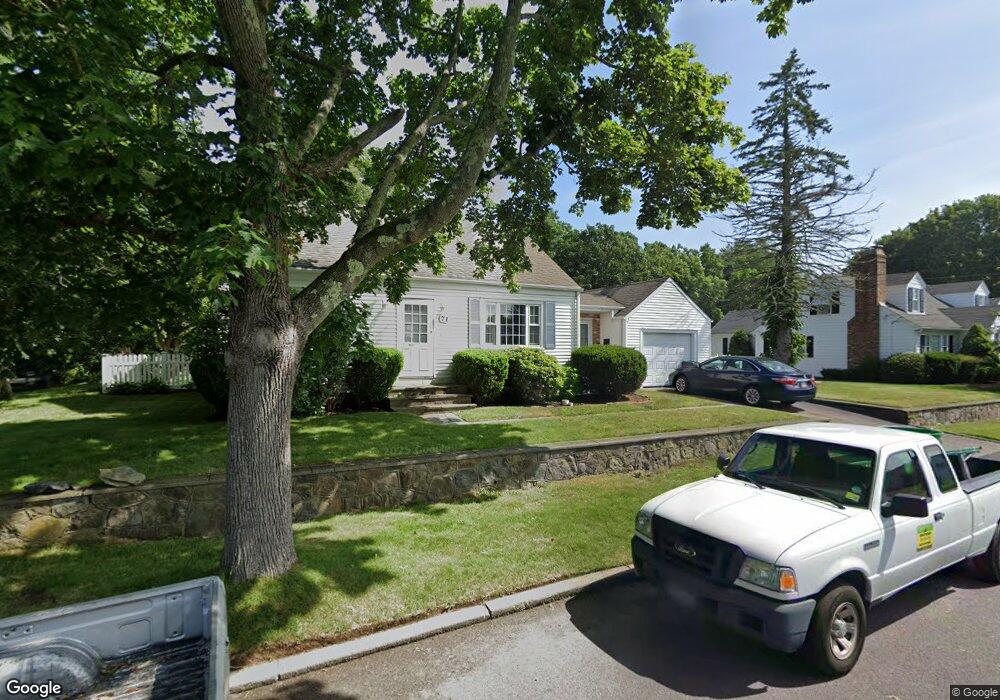
71 Greylock Rd Bristol, RI 02809
Bristol Highlands NeighborhoodEstimated Value: $584,935 - $759,000
4
Beds
2
Baths
1,708
Sq Ft
$402/Sq Ft
Est. Value
About This Home
This home is located at 71 Greylock Rd, Bristol, RI 02809 and is currently estimated at $685,984, approximately $401 per square foot. 71 Greylock Rd is a home located in Bristol County with nearby schools including Mt. Hope High School, Highlander Charter Middle and High School, and Our Lady of Mt. Carmel School.
Ownership History
Date
Name
Owned For
Owner Type
Purchase Details
Closed on
May 28, 2010
Sold by
Gaidmore Amy Michelle Le and Gaidmore Gerald Paul
Bought by
Passerello Robin
Current Estimated Value
Home Financials for this Owner
Home Financials are based on the most recent Mortgage that was taken out on this home.
Original Mortgage
$280,250
Interest Rate
5.13%
Mortgage Type
Purchase Money Mortgage
Purchase Details
Closed on
Jun 30, 2006
Sold by
Deaville Anthony
Bought by
Gaidmore Amy and Gaidmore Gerald
Home Financials for this Owner
Home Financials are based on the most recent Mortgage that was taken out on this home.
Original Mortgage
$249,000
Interest Rate
6.58%
Mortgage Type
Purchase Money Mortgage
Purchase Details
Closed on
Apr 27, 2005
Sold by
Morra Alan and Morra Karl
Bought by
Denville Anthony
Create a Home Valuation Report for This Property
The Home Valuation Report is an in-depth analysis detailing your home's value as well as a comparison with similar homes in the area
Home Values in the Area
Average Home Value in this Area
Purchase History
| Date | Buyer | Sale Price | Title Company |
|---|---|---|---|
| Passerello Robin | $295,000 | -- | |
| Gaidmore Amy | $349,000 | -- | |
| Denville Anthony | $330,000 | -- |
Source: Public Records
Mortgage History
| Date | Status | Borrower | Loan Amount |
|---|---|---|---|
| Open | Denville Anthony | $266,000 | |
| Closed | Denville Anthony | $280,250 | |
| Previous Owner | Denville Anthony | $291,000 | |
| Previous Owner | Denville Anthony | $249,000 |
Source: Public Records
Tax History Compared to Growth
Tax History
| Year | Tax Paid | Tax Assessment Tax Assessment Total Assessment is a certain percentage of the fair market value that is determined by local assessors to be the total taxable value of land and additions on the property. | Land | Improvement |
|---|---|---|---|---|
| 2025 | $5,094 | $368,600 | $172,500 | $196,100 |
| 2024 | $5,094 | $368,600 | $172,500 | $196,100 |
| 2023 | $4,924 | $368,600 | $172,500 | $196,100 |
| 2022 | $4,792 | $368,600 | $172,500 | $196,100 |
| 2021 | $4,797 | $333,600 | $171,500 | $162,100 |
| 2020 | $4,694 | $333,600 | $171,500 | $162,100 |
| 2019 | $4,577 | $333,600 | $171,500 | $162,100 |
| 2018 | $5,106 | $332,000 | $172,600 | $159,400 |
| 2017 | $4,263 | $285,700 | $155,900 | $129,800 |
| 2016 | $3,822 | $258,800 | $129,000 | $129,800 |
| 2015 | $3,631 | $258,800 | $129,000 | $129,800 |
| 2014 | -- | $224,460 | $102,600 | $121,860 |
Source: Public Records
Map
Nearby Homes