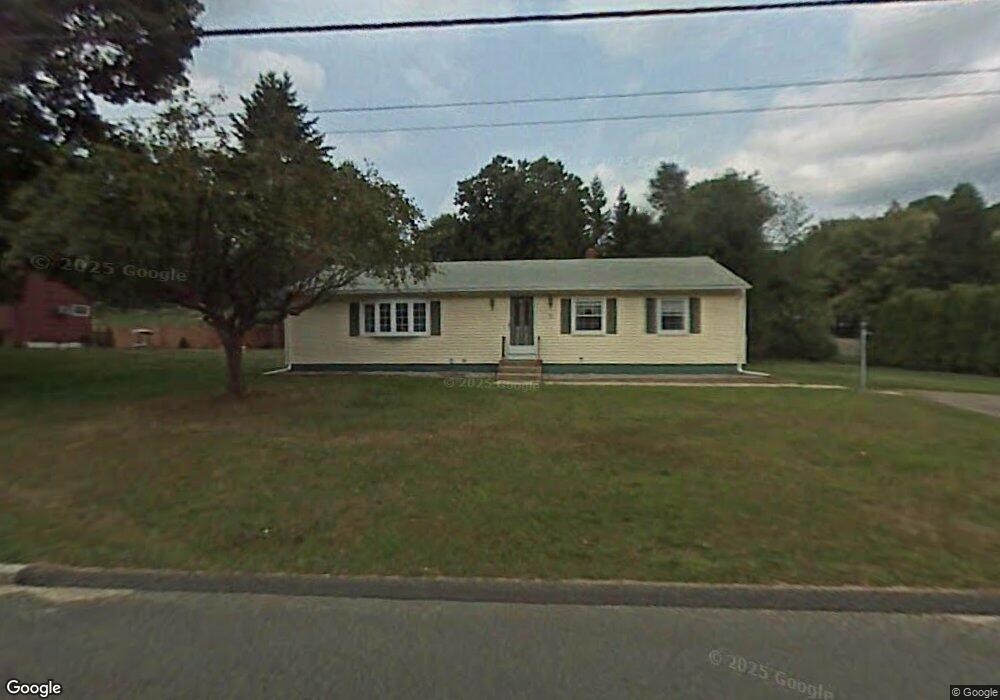
71 Kendall St Ludlow, MA 01056
Estimated Value: $318,000 - $354,000
3
Beds
1
Bath
1,352
Sq Ft
$249/Sq Ft
Est. Value
About This Home
This home is located at 71 Kendall St, Ludlow, MA 01056 and is currently estimated at $337,102, approximately $249 per square foot. 71 Kendall St is a home located in Hampden County with nearby schools including East Street Elementary School, Chapin Street Elementary School, and Paul R. Baird Middle School.
Ownership History
Date
Name
Owned For
Owner Type
Purchase Details
Closed on
Sep 30, 2019
Sold by
Lemay Judith A Est and Ganhao
Bought by
Ganhao Helder M
Current Estimated Value
Purchase Details
Closed on
Mar 28, 1985
Bought by
Lemay Judith A and Gonhao Helder M
Create a Home Valuation Report for This Property
The Home Valuation Report is an in-depth analysis detailing your home's value as well as a comparison with similar homes in the area
Home Values in the Area
Average Home Value in this Area
Purchase History
| Date | Buyer | Sale Price | Title Company |
|---|---|---|---|
| Ganhao Helder M | -- | -- | |
| Ganhao Helder M | -- | -- | |
| Lemay Judith A | $61,000 | -- |
Source: Public Records
Mortgage History
| Date | Status | Borrower | Loan Amount |
|---|---|---|---|
| Previous Owner | Lemay Judith A | $10,000 | |
| Previous Owner | Lemay Judith A | $76,000 | |
| Previous Owner | Lemay Judith A | $3,300 | |
| Previous Owner | Lemay Judith A | $54,000 |
Source: Public Records
Tax History Compared to Growth
Tax History
| Year | Tax Paid | Tax Assessment Tax Assessment Total Assessment is a certain percentage of the fair market value that is determined by local assessors to be the total taxable value of land and additions on the property. | Land | Improvement |
|---|---|---|---|---|
| 2025 | $5,012 | $288,900 | $90,900 | $198,000 |
| 2024 | $4,796 | $265,100 | $90,800 | $174,300 |
| 2023 | $4,351 | $223,000 | $83,100 | $139,900 |
| 2022 | $3,898 | $195,000 | $76,200 | $118,800 |
| 2021 | $3,959 | $187,800 | $76,200 | $111,600 |
| 2020 | $3,833 | $185,900 | $75,000 | $110,900 |
| 2019 | $3,615 | $182,400 | $74,300 | $108,100 |
| 2018 | $3,422 | $180,000 | $74,300 | $105,700 |
| 2017 | $3,352 | $180,900 | $72,800 | $108,100 |
| 2016 | $3,180 | $175,400 | $71,400 | $104,000 |
| 2015 | $3,014 | $174,300 | $70,600 | $103,700 |
Source: Public Records
Map
Nearby Homes
- 166 Kendall St
- 41 Deroche Cir
- 61 Massachusetts Ave
- 482 Holyoke St
- 350 West St Unit 19
- 319 West St
- 87 Prokop Ave
- 251 West St
- 3 Fontaine St
- 98 Fuller St Unit 32
- 60 Loopley St
- 84 Fuller St Unit 1
- 42 Loopley St
- 33 Grimard St
- 42 Roy St
- 70 Fuller St
- 1307 Burnett Rd
- '0' Rood St
- 517 Ideal Ln Unit 401
- 0 Fuller St Unit 73409741