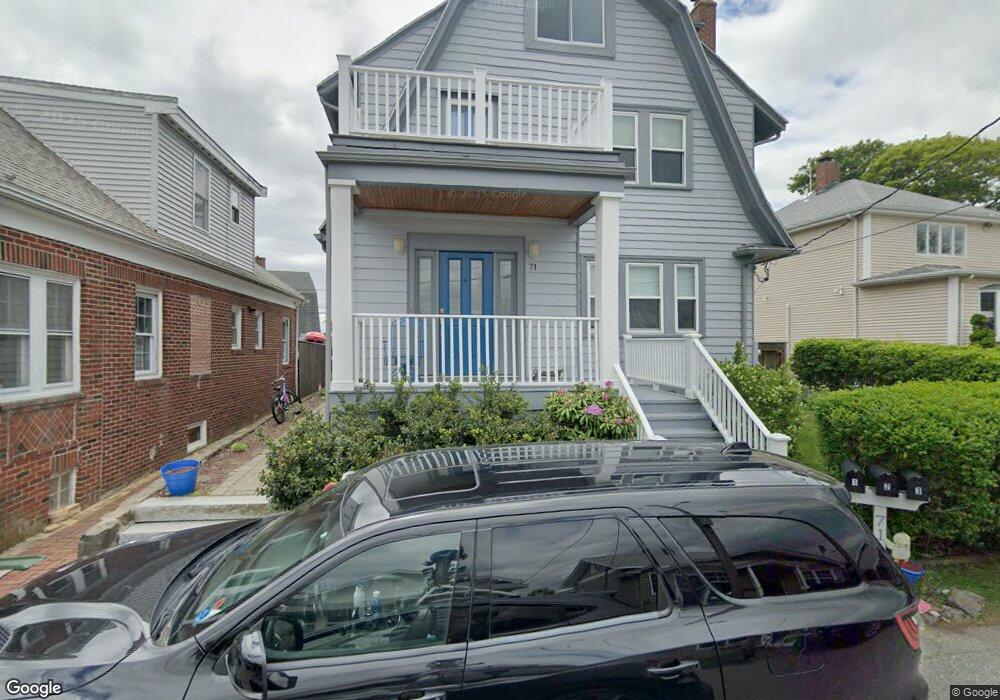
71 Lennox Rd Unit 2 Nahant, MA 01908
Estimated Value: $511,062 - $720,000
2
Beds
1
Bath
1,152
Sq Ft
$534/Sq Ft
Est. Value
About This Home
This home is located at 71 Lennox Rd Unit 2, Nahant, MA 01908 and is currently estimated at $614,766, approximately $533 per square foot. 71 Lennox Rd Unit 2 is a home located in Essex County with nearby schools including Johnson Elementary School, Swampscott Middle School, and Swampscott High School.
Ownership History
Date
Name
Owned For
Owner Type
Purchase Details
Closed on
Oct 30, 2008
Sold by
Twin Islands Condo
Bought by
Beauchine Michele A
Current Estimated Value
Home Financials for this Owner
Home Financials are based on the most recent Mortgage that was taken out on this home.
Original Mortgage
$223,125
Outstanding Balance
$144,643
Interest Rate
5.83%
Mortgage Type
Purchase Money Mortgage
Estimated Equity
$470,123
Purchase Details
Closed on
Jun 26, 2006
Sold by
Riley Edward F and Riley Marianne P
Bought by
Riley Edward F and Riley Marianne P
Create a Home Valuation Report for This Property
The Home Valuation Report is an in-depth analysis detailing your home's value as well as a comparison with similar homes in the area
Home Values in the Area
Average Home Value in this Area
Purchase History
| Date | Buyer | Sale Price | Title Company |
|---|---|---|---|
| Beauchine Michele A | $262,500 | -- | |
| Beauchine Michele A | $262,500 | -- | |
| Riley Edward F | -- | -- |
Source: Public Records
Mortgage History
| Date | Status | Borrower | Loan Amount |
|---|---|---|---|
| Open | Beauchine Michele A | $223,125 | |
| Closed | Riley Edward F | $223,125 |
Source: Public Records
Tax History Compared to Growth
Tax History
| Year | Tax Paid | Tax Assessment Tax Assessment Total Assessment is a certain percentage of the fair market value that is determined by local assessors to be the total taxable value of land and additions on the property. | Land | Improvement |
|---|---|---|---|---|
| 2025 | $4,294 | $469,300 | $0 | $469,300 |
| 2024 | $4,257 | $469,300 | $0 | $469,300 |
| 2023 | $3,926 | $431,900 | $0 | $431,900 |
| 2022 | $4,164 | $425,300 | $0 | $425,300 |
| 2021 | $4,470 | $425,300 | $0 | $425,300 |
| 2020 | $4,467 | $407,200 | $0 | $407,200 |
| 2019 | $4,083 | $374,200 | $0 | $374,200 |
| 2018 | $3,531 | $344,500 | $0 | $344,500 |
| 2017 | $3,607 | $344,500 | $0 | $344,500 |
| 2016 | $3,144 | $298,900 | $0 | $298,900 |
| 2015 | $2,672 | $244,700 | $0 | $244,700 |
| 2014 | $2,699 | $244,700 | $0 | $244,700 |
Source: Public Records
Map
Nearby Homes
- 167 Wilson Rd
- 36 Lennox Rd
- 75 Castle Rd
- 68 Spring Rd
- 23 Phillips Rd
- 66 Ocean St
- 17 Pearl Rd
- 60 Willow Rd
- 43 Maple Ave
- 2 Goddard Dr
- 41 Gardner Rd
- 303 Nahant Rd
- 58 Breezy Hill Terrace
- 150 Bass Point Rd Unit 150
- 183 Bass Point Rd
- 162 Willow Rd Unit 11
- 51 Cliff St
- 3 Cliff St
- 98 Lynnway Unit 102
- 45 Tudor St Unit 5