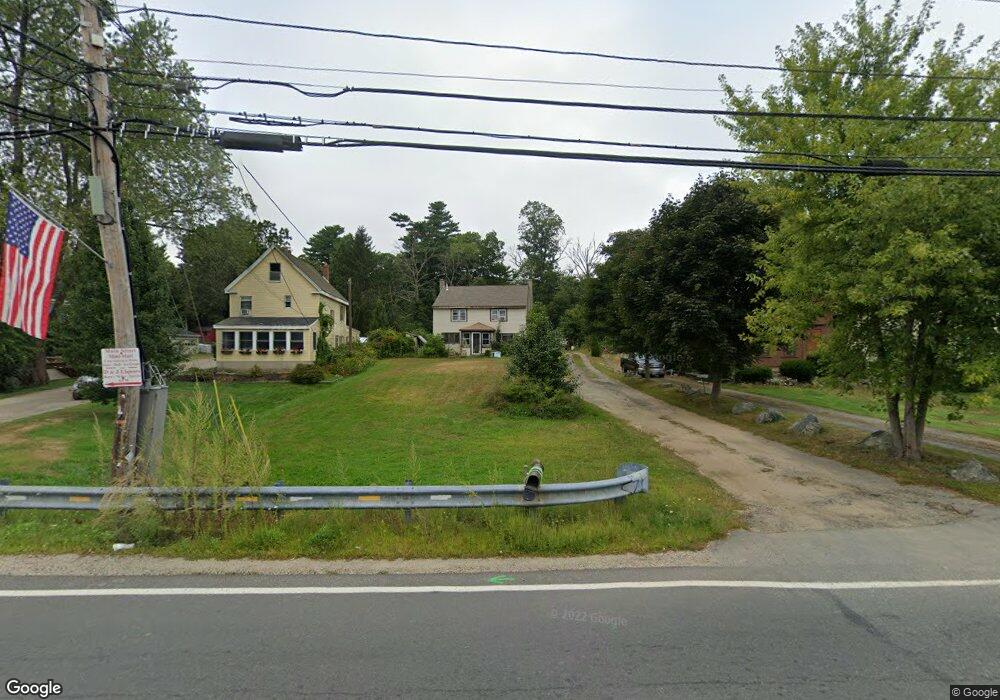
71 Main St Byfield, MA 01922
Newbury AreaEstimated Value: $708,000 - $788,000
3
Beds
2
Baths
1,920
Sq Ft
$390/Sq Ft
Est. Value
About This Home
This home is located at 71 Main St, Byfield, MA 01922 and is currently estimated at $748,227, approximately $389 per square foot. 71 Main St is a home located in Essex County with nearby schools including Triton Regional High School and The Governors Academy.
Create a Home Valuation Report for This Property
The Home Valuation Report is an in-depth analysis detailing your home's value as well as a comparison with similar homes in the area
Home Values in the Area
Average Home Value in this Area
Tax History
We collect this data history from publicly available records. To have your information removed, we recommend requesting removal directly through your county’s website.
| Year | Tax Paid | Tax Assessment Tax Assessment Total Assessment is a certain percentage of the fair market value that is determined by local assessors to be the total taxable value of land and additions on the property. | Land | Improvement |
|---|---|---|---|---|
| 2025 | $4,704 | $631,400 | $373,400 | $258,000 |
| 2024 | $4,467 | $581,600 | $334,100 | $247,500 |
| 2023 | $4,427 | $510,600 | $285,000 | $225,600 |
| 2022 | $4,397 | $451,900 | $255,500 | $196,400 |
| 2021 | $4,064 | $381,200 | $196,500 | $184,700 |
| 2020 | $4,125 | $375,300 | $196,500 | $178,800 |
| 2019 | $3,845 | $355,700 | $176,900 | $178,800 |
| 2018 | $3,718 | $341,100 | $176,900 | $164,200 |
| 2017 | $3,572 | $336,700 | $176,900 | $159,800 |
| 2016 | $3,252 | $285,300 | $137,600 | $147,700 |
| 2015 | $3,137 | $272,300 | $127,700 | $144,600 |
| 2014 | $3,082 | $272,300 | $127,700 | $144,600 |
Source: Public Records
Map
Nearby Homes
- 93 Main St
- 5 Kent Way
- 34 Central St Unit 34 Lincoln
- 34 Central St Unit 44 Kennedy
- 34 Central St Unit 31 Washing
- 34 Central St Unit 4 Madison
- 34 Central St Unit 1
- 6 Cricket Ln Unit 6-Dogwood
- 14 Web Rd
- 11 Cricket Ln Unit 11-Chestnut
- 66 Parish Rd Unit 8
- 66 Parish Rd Unit 4
- 13 Cricket Ln Unit 13-DOGWOOD
- 75 Pearson Dr
- 185 Ash St
- 459 North St
- 46 Jewett St
- 56 Jewett St
- 83 Thurlow St
- 109 Thurlow St
Your Personal Tour Guide
Ask me questions while you tour the home.