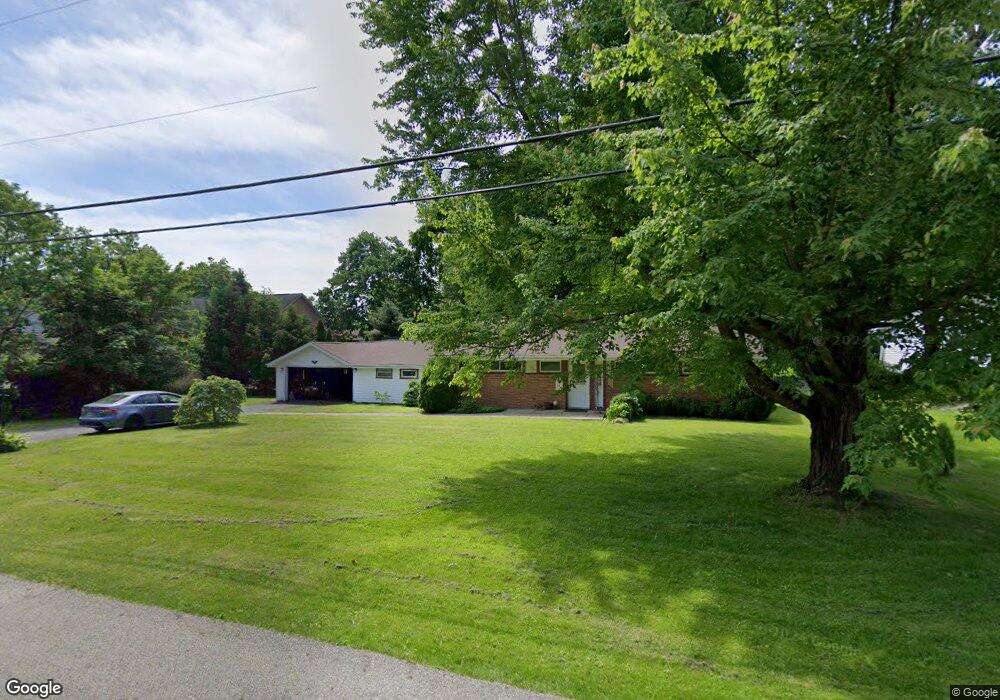
71 Maple St Canfield, OH 44406
Estimated Value: $194,000 - $254,000
3
Beds
2
Baths
1,578
Sq Ft
$139/Sq Ft
Est. Value
About This Home
This home is located at 71 Maple St, Canfield, OH 44406 and is currently estimated at $219,394, approximately $139 per square foot. 71 Maple St is a home located in Mahoning County with nearby schools including Canfield Village Middle School, Canfield High School, and St Charles Elementary School.
Ownership History
Date
Name
Owned For
Owner Type
Purchase Details
Closed on
Jun 5, 2009
Sold by
Mellot Robert L and Mellot Trisha A
Bought by
Haldiman Paul W and Haldiman Charlotte A
Current Estimated Value
Home Financials for this Owner
Home Financials are based on the most recent Mortgage that was taken out on this home.
Original Mortgage
$78,551
Outstanding Balance
$48,716
Interest Rate
4.83%
Mortgage Type
FHA
Estimated Equity
$170,678
Purchase Details
Closed on
Nov 30, 1999
Sold by
Johnson Bob J
Bought by
Mellot Robert L and Mellot Trisha A
Home Financials for this Owner
Home Financials are based on the most recent Mortgage that was taken out on this home.
Original Mortgage
$61,000
Interest Rate
7.97%
Purchase Details
Closed on
Apr 5, 1996
Sold by
Nelson Richard
Bought by
Johnson Bob J
Home Financials for this Owner
Home Financials are based on the most recent Mortgage that was taken out on this home.
Original Mortgage
$72,200
Interest Rate
7.36%
Mortgage Type
New Conventional
Purchase Details
Closed on
Dec 18, 1992
Bought by
Nelson C Richard
Create a Home Valuation Report for This Property
The Home Valuation Report is an in-depth analysis detailing your home's value as well as a comparison with similar homes in the area
Home Values in the Area
Average Home Value in this Area
Purchase History
| Date | Buyer | Sale Price | Title Company |
|---|---|---|---|
| Haldiman Paul W | $80,000 | Attorney | |
| Mellot Robert L | $78,000 | -- | |
| Johnson Bob J | $76,000 | -- | |
| Nelson C Richard | -- | -- |
Source: Public Records
Mortgage History
| Date | Status | Borrower | Loan Amount |
|---|---|---|---|
| Open | Haldiman Paul W | $78,551 | |
| Previous Owner | Mellot Robert L | $61,000 | |
| Previous Owner | Johnson Bob J | $72,200 |
Source: Public Records
Tax History
| Year | Tax Paid | Tax Assessment Tax Assessment Total Assessment is a certain percentage of the fair market value that is determined by local assessors to be the total taxable value of land and additions on the property. | Land | Improvement |
|---|---|---|---|---|
| 2025 | $2,199 | $51,000 | $10,150 | $40,850 |
| 2024 | $2,199 | $51,000 | $10,150 | $40,850 |
| 2023 | $2,165 | $51,000 | $10,150 | $40,850 |
| 2022 | $1,805 | $33,820 | $9,620 | $24,200 |
| 2021 | $1,751 | $33,820 | $9,620 | $24,200 |
| 2020 | $1,758 | $33,820 | $9,620 | $24,200 |
| 2019 | $1,558 | $27,160 | $9,620 | $17,540 |
| 2018 | $1,539 | $27,160 | $9,620 | $17,540 |
| 2017 | $1,536 | $27,160 | $9,620 | $17,540 |
| 2016 | $1,508 | $27,170 | $9,620 | $17,550 |
| 2015 | $1,475 | $27,170 | $9,620 | $17,550 |
| 2014 | $1,481 | $27,170 | $9,620 | $17,550 |
| 2013 | $1,427 | $27,170 | $9,620 | $17,550 |
Source: Public Records
Map
Nearby Homes
- 223 Fairview Ave
- 124 Wadsworth St
- 30 Newton Square Dr Unit 3
- 30 Newton Square Dr Unit 1
- 71 Hilltop Blvd
- 315 W Main St
- 36 Hilltop Blvd
- 120 Talsman Dr Unit 4
- 331 Verdant Ln
- 361 Hilltop Blvd Unit 1A
- 6916 S Raccoon Rd
- 9 Willow Way
- 51 Villa Theresa Ln
- 61 Villa Theresa Ln
- 21 Villa Theresa Ln
- 31 Villa Theresa Ln
- 71 Villa Theresa Ln
- 81 Villa Theresa Ln
- 91 Villa Theresa Ln
- 41 Villa Theresa Ln
Your Personal Tour Guide
Ask me questions while you tour the home.