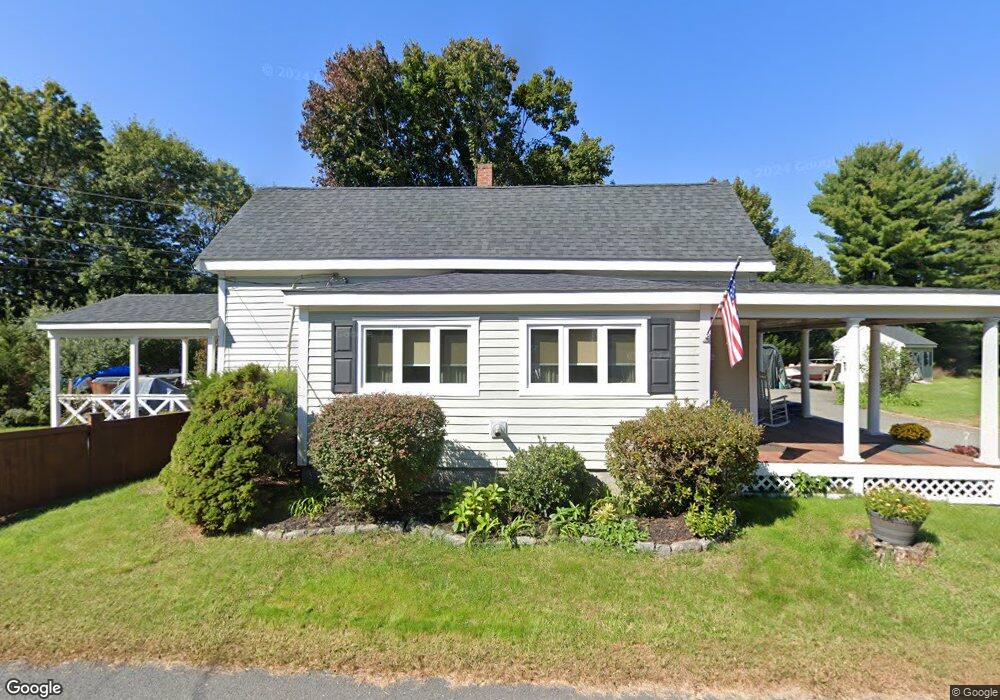
71 Mohawk St Sharon, MA 02067
Estimated Value: $513,000 - $627,000
3
Beds
1
Bath
1,225
Sq Ft
$462/Sq Ft
Est. Value
About This Home
This home is located at 71 Mohawk St, Sharon, MA 02067 and is currently estimated at $566,008, approximately $462 per square foot. 71 Mohawk St is a home located in Norfolk County with nearby schools including Heights Elementary School, Sharon Middle School, and Sharon High School.
Ownership History
Date
Name
Owned For
Owner Type
Purchase Details
Closed on
Jul 29, 1994
Sold by
Tara Nt
Bought by
Gallagher Drew H and Gallagher Laura L
Current Estimated Value
Home Financials for this Owner
Home Financials are based on the most recent Mortgage that was taken out on this home.
Original Mortgage
$93,000
Interest Rate
8.25%
Mortgage Type
Purchase Money Mortgage
Purchase Details
Closed on
Oct 30, 1991
Sold by
Kingsley Norman A
Bought by
Tara Nominee Rt
Home Financials for this Owner
Home Financials are based on the most recent Mortgage that was taken out on this home.
Original Mortgage
$73,000
Interest Rate
8.9%
Mortgage Type
Purchase Money Mortgage
Create a Home Valuation Report for This Property
The Home Valuation Report is an in-depth analysis detailing your home's value as well as a comparison with similar homes in the area
Home Values in the Area
Average Home Value in this Area
Purchase History
| Date | Buyer | Sale Price | Title Company |
|---|---|---|---|
| Gallagher Drew H | $113,000 | -- | |
| Tara Nominee Rt | $78,000 | -- |
Source: Public Records
Mortgage History
| Date | Status | Borrower | Loan Amount |
|---|---|---|---|
| Closed | Tara Nominee Rt | $93,000 | |
| Previous Owner | Tara Nominee Rt | $73,000 | |
| Previous Owner | Tara Nominee Rt | $53,000 |
Source: Public Records
Tax History
| Year | Tax Paid | Tax Assessment Tax Assessment Total Assessment is a certain percentage of the fair market value that is determined by local assessors to be the total taxable value of land and additions on the property. | Land | Improvement |
|---|---|---|---|---|
| 2025 | $8,235 | $471,100 | $341,600 | $129,500 |
| 2024 | $7,786 | $442,900 | $313,400 | $129,500 |
| 2023 | $7,646 | $411,300 | $292,900 | $118,400 |
| 2022 | $7,051 | $357,000 | $244,100 | $112,900 |
| 2021 | $6,944 | $339,900 | $230,300 | $109,600 |
| 2020 | $6,458 | $339,900 | $230,300 | $109,600 |
| 2019 | $6,083 | $313,400 | $203,800 | $109,600 |
| 2018 | $5,993 | $309,400 | $199,800 | $109,600 |
| 2017 | $5,813 | $296,300 | $186,700 | $109,600 |
| 2016 | $5,757 | $286,300 | $186,700 | $99,600 |
| 2015 | $5,333 | $262,700 | $171,300 | $91,400 |
| 2014 | $4,926 | $239,700 | $155,700 | $84,000 |
Source: Public Records
Map
Nearby Homes
- 174 E Foxboro St
- 2 Foxfire Dr
- 3 Wampanoag Rd
- 132 Massapoag Ave
- 668 S Main St
- 22 Ames Ct
- 5 Trowel Pond Shop Rd Unit C
- 58 Ames St
- 15 Paul Revere Rd
- 133 Ames St
- 2 Sherwood Cir
- 180 Old Post Rd Unit 202
- 180 Old Post Rd Unit 206
- 180 Old Post Rd Unit 308
- 180 Old Post Rd Unit 201
- 180 Old Post Rd Unit 405
- 180 Old Post Rd Unit 207
- 1 Maura Elizabeth Ln
- 29 Station St
- 63 Highland St
Your Personal Tour Guide
Ask me questions while you tour the home.