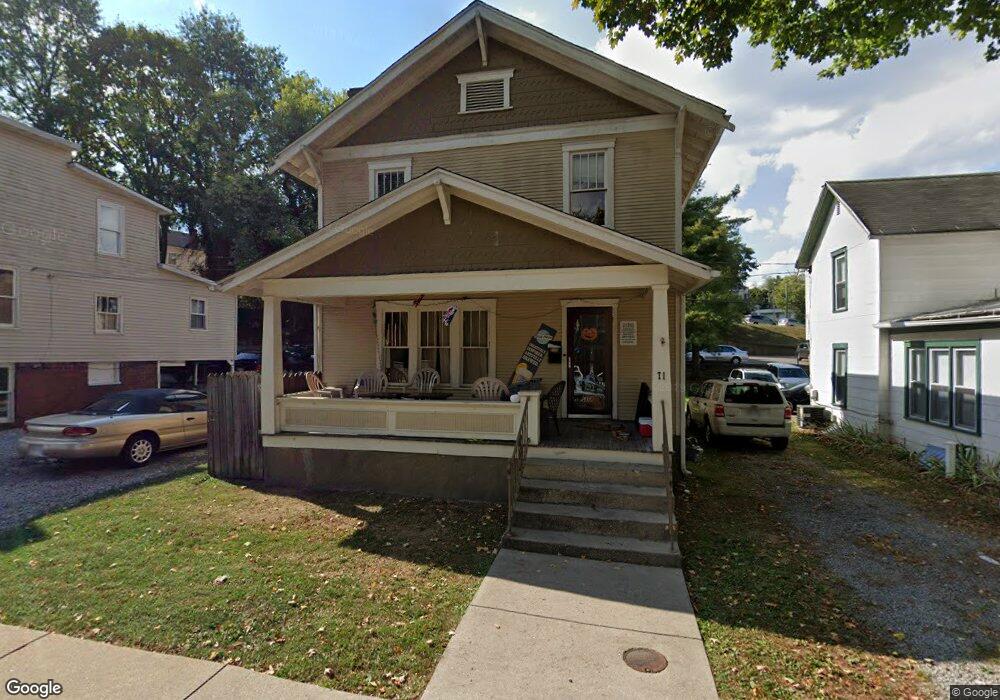
71 N High St Athens, OH 45701
Estimated Value: $224,000 - $250,000
3
Beds
1
Bath
1,404
Sq Ft
$170/Sq Ft
Est. Value
About This Home
This home is located at 71 N High St, Athens, OH 45701 and is currently estimated at $238,333, approximately $169 per square foot. 71 N High St is a home located in Athens County with nearby schools including West Elementary School, Athens Middle School, and Athens High School.
Ownership History
Date
Name
Owned For
Owner Type
Purchase Details
Closed on
Mar 9, 2017
Sold by
Mcmillan Alan J and Mcmillan Kateri M
Bought by
Cranberry Row Llc
Current Estimated Value
Purchase Details
Closed on
Mar 30, 2007
Sold by
Latner Property Ltd
Bought by
Cranberry Row Llc
Home Financials for this Owner
Home Financials are based on the most recent Mortgage that was taken out on this home.
Original Mortgage
$384,546
Interest Rate
6.31%
Mortgage Type
Purchase Money Mortgage
Purchase Details
Closed on
Jul 2, 2003
Sold by
Bolin Mickel M
Bought by
Latner Property Ltd
Purchase Details
Closed on
Aug 11, 2000
Sold by
Michael Sami I and Michael Therese H
Bought by
Bolin Mickel M
Purchase Details
Closed on
Mar 31, 1999
Sold by
Michael Sami I
Bought by
Michael Sami I and Michael Therese H
Create a Home Valuation Report for This Property
The Home Valuation Report is an in-depth analysis detailing your home's value as well as a comparison with similar homes in the area
Home Values in the Area
Average Home Value in this Area
Purchase History
| Date | Buyer | Sale Price | Title Company |
|---|---|---|---|
| Cranberry Row Llc | -- | Attorney | |
| Cranberry Row Llc | $426,800 | Attorney | |
| Latner Property Ltd | -- | -- | |
| Bolin Mickel M | $163,000 | -- | |
| Michael Sami I | -- | -- |
Source: Public Records
Mortgage History
| Date | Status | Borrower | Loan Amount |
|---|---|---|---|
| Previous Owner | Cranberry Row Llc | $384,546 |
Source: Public Records
Tax History Compared to Growth
Tax History
| Year | Tax Paid | Tax Assessment Tax Assessment Total Assessment is a certain percentage of the fair market value that is determined by local assessors to be the total taxable value of land and additions on the property. | Land | Improvement |
|---|---|---|---|---|
| 2024 | $2,856 | $52,490 | $5,060 | $47,430 |
| 2023 | $2,655 | $52,490 | $5,060 | $47,430 |
| 2022 | $2,228 | $42,110 | $5,060 | $37,050 |
| 2021 | $2,238 | $42,110 | $5,060 | $37,050 |
| 2020 | $2,175 | $42,110 | $5,060 | $37,050 |
| 2019 | $2,115 | $40,470 | $4,540 | $35,930 |
| 2018 | $2,088 | $40,470 | $4,540 | $35,930 |
| 2017 | $3,604 | $40,470 | $4,540 | $35,930 |
| 2016 | $1,802 | $36,090 | $4,320 | $31,770 |
| 2015 | $3,296 | $36,090 | $4,320 | $31,770 |
| 2014 | $3,296 | $36,090 | $4,320 | $31,770 |
| 2013 | $3,127 | $35,190 | $4,320 | $30,870 |
Source: Public Records
Map
Nearby Homes
- 80 Court
- 71 W Washington St
- 12 Walker St
- 11 Walker St
- 31 1st St
- 64 Franklin Ave
- 7 Elizabeth Dr
- 17 Ring St
- 193 N Lancaster St
- 0 Roberts St
- 10 1st St
- 214 W State St
- 131 Grosvenor St
- 56.15/15.5 Central & Clark
- 98 Central Ave
- 18 Clarke St
- 15 S Shafer St Unit 1509
- 273 E State St
- 12 McGuffey Ln
- 12 Mc Guffey Ln