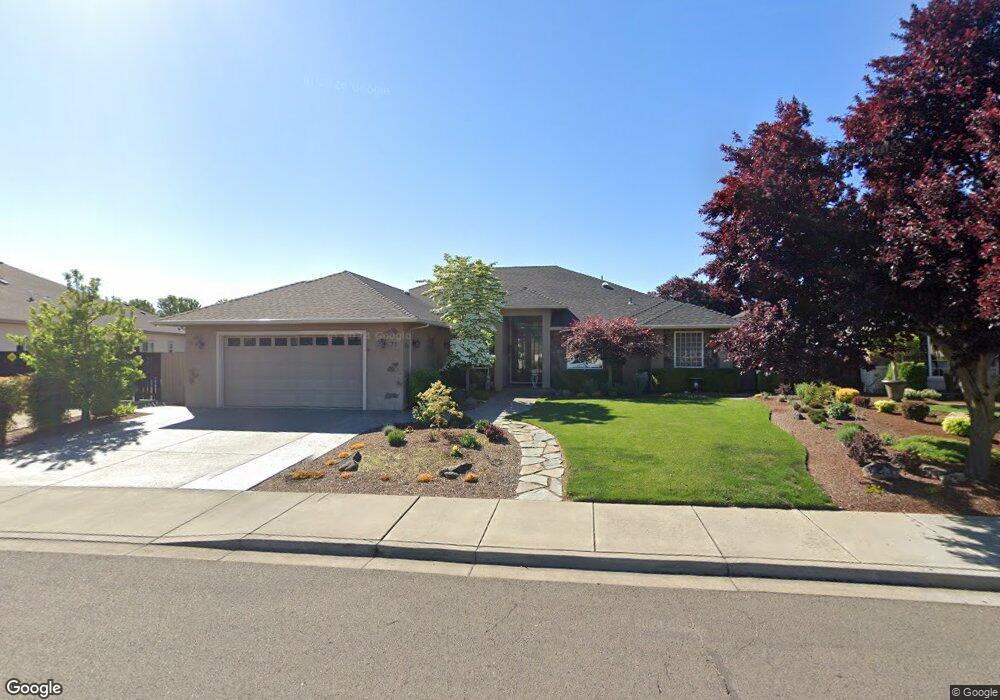
71 Pebble Creek Dr Eagle Point, OR 97524
Estimated Value: $618,463 - $787,000
3
Beds
2
Baths
2,942
Sq Ft
$242/Sq Ft
Est. Value
About This Home
This home is located at 71 Pebble Creek Dr, Eagle Point, OR 97524 and is currently estimated at $711,616, approximately $241 per square foot. 71 Pebble Creek Dr is a home located in Jackson County with nearby schools including Eagle Point Middle School, White Mountain Middle School, and Eagle Point High School.
Ownership History
Date
Name
Owned For
Owner Type
Purchase Details
Closed on
Mar 22, 2018
Sold by
Frey Martin H and Frey Kristine R
Bought by
Martin H Frey And Kristine R Frey Revocable T and Frey
Current Estimated Value
Purchase Details
Closed on
Oct 6, 2010
Sold by
Magel Brian J
Bought by
Frey Martin H and Frey Kristine R
Purchase Details
Closed on
Aug 17, 2006
Sold by
Magel Christine
Bought by
Magel Brian J
Home Financials for this Owner
Home Financials are based on the most recent Mortgage that was taken out on this home.
Original Mortgage
$496,000
Interest Rate
6.76%
Mortgage Type
Purchase Money Mortgage
Purchase Details
Closed on
Jul 6, 2004
Sold by
Eagle Point Developments Llc
Bought by
Magel Custom Homes Inc
Home Financials for this Owner
Home Financials are based on the most recent Mortgage that was taken out on this home.
Original Mortgage
$127,200
Interest Rate
5.95%
Mortgage Type
Purchase Money Mortgage
Create a Home Valuation Report for This Property
The Home Valuation Report is an in-depth analysis detailing your home's value as well as a comparison with similar homes in the area
Home Values in the Area
Average Home Value in this Area
Purchase History
| Date | Buyer | Sale Price | Title Company |
|---|---|---|---|
| Martin H Frey And Kristine R Frey Revocable T | -- | None Listed On Document | |
| Frey Martin H | $306,000 | Ticor Title Company Oregon | |
| Magel Brian J | $620,000 | Lawyers Title Ins | |
| Magel Christine | $600,000 | Lawyers Title Ins | |
| Magel Custom Homes Inc | $159,000 | Lawyers Title Ins |
Source: Public Records
Mortgage History
| Date | Status | Borrower | Loan Amount |
|---|---|---|---|
| Previous Owner | Magel Brian J | $496,000 | |
| Previous Owner | Magel Custom Homes Inc | $127,200 |
Source: Public Records
Tax History
| Year | Tax Paid | Tax Assessment Tax Assessment Total Assessment is a certain percentage of the fair market value that is determined by local assessors to be the total taxable value of land and additions on the property. | Land | Improvement |
|---|---|---|---|---|
| 2026 | $6,109 | $408,090 | $128,000 | $280,090 |
| 2025 | $5,965 | $435,940 | $75,280 | $360,660 |
| 2024 | $5,965 | $423,250 | $73,090 | $350,160 |
| 2023 | $5,763 | $410,930 | $70,960 | $339,970 |
| 2022 | $5,606 | $410,930 | $70,960 | $339,970 |
| 2021 | $5,440 | $398,970 | $68,900 | $330,070 |
| 2020 | $5,779 | $387,350 | $66,900 | $320,450 |
| 2019 | $5,690 | $365,120 | $63,060 | $302,060 |
| 2018 | $5,582 | $354,490 | $61,220 | $293,270 |
| 2017 | $5,445 | $354,490 | $61,220 | $293,270 |
| 2016 | $5,339 | $334,150 | $57,710 | $276,440 |
| 2015 | $5,164 | $334,150 | $57,710 | $276,440 |
| 2014 | -- | $314,980 | $54,400 | $260,580 |
Source: Public Records
Map
Nearby Homes
- 888 Arrowhead Trail
- 621 S Shasta Ave
- 837 S Royal Ave
- 869 St Andrews Way
- 936 Arrowhead Trail
- 964 Pumpkin Ridge
- 407 S Shasta Ave
- 522 Meadow Ln
- 620 S Royal Ave
- 133 Edith Cir
- 995 Pumpkin Ridge
- 19 Pine Ct
- 1065 S Shasta Ave
- 997 Arrowhead Trail
- 131 Spanish Bay Ct
- 0 Echo Way Unit Tax Lot 902
- 0 Echo Way Unit 220215112
- 0 Echo Way Unit Tax Lot 901
- 0 Echo Way Unit Tax Lot 900
- 650 Sarah Ln
- 77 Pebble Creek Dr
- 65 Pebble Creek Dr
- 50 Pebble Creek Dr
- 364 Pebble Creek Dr
- 0 Pebble Creek Dr
- 428 Arrowhead Trail Unit LOT 520
- 83 Pebble Creek Dr
- 422 Arrowhead Trail
- 82 Pebble Creek
- 82 Pebble Creek Dr
- 59 Pebble Creek Dr
- 59 Pebble Creek Dr Unit 342
- 76 Pebble Creek Dr
- 88 Pebble Creek Dr
- 416 Arrowhead Trail Unit LOT 522
- 89 Pebble Creek Dr
- 53 Pebble Creek Dr
- 60 Pebble Creek Dr
- 16 Oak Hills Ct
- 94 Pebble Creek Dr
Your Personal Tour Guide
Ask me questions while you tour the home.