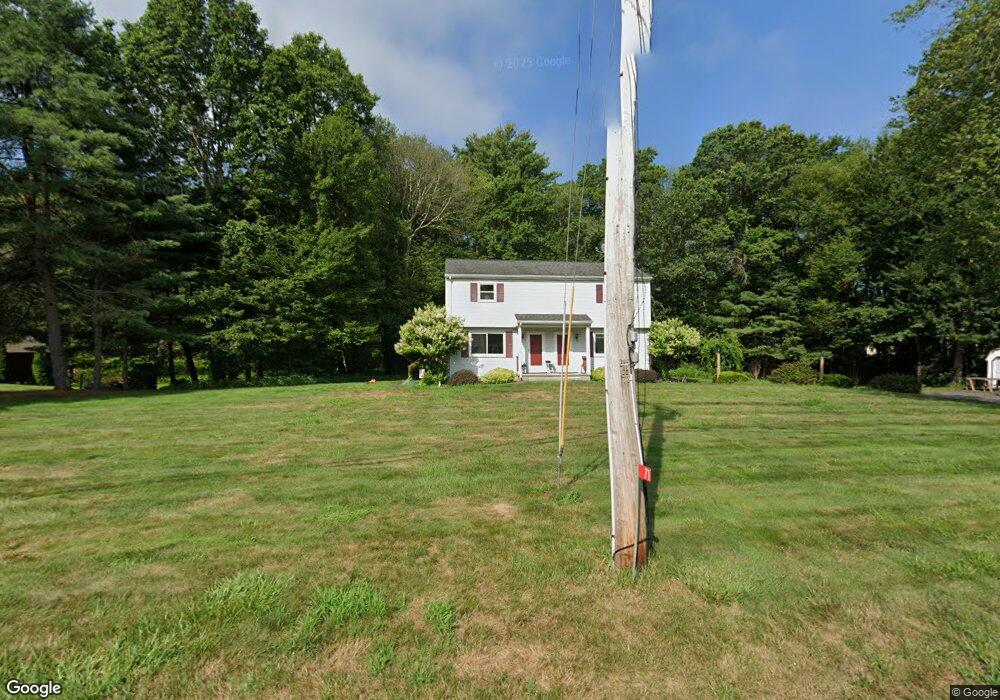
71 Prospect St Hatfield, MA 01038
Estimated Value: $302,000 - $565,000
4
Beds
2
Baths
1,764
Sq Ft
$258/Sq Ft
Est. Value
About This Home
This home is located at 71 Prospect St, Hatfield, MA 01038 and is currently estimated at $454,804, approximately $257 per square foot. 71 Prospect St is a home located in Hampshire County with nearby schools including Browerville Elementary School and Brooklyn Center Middle School.
Ownership History
Date
Name
Owned For
Owner Type
Purchase Details
Closed on
Jul 10, 2002
Sold by
Hurley Barbara E and Hurley Thomas J
Bought by
Borowski Alan and Borowski Edwin
Current Estimated Value
Home Financials for this Owner
Home Financials are based on the most recent Mortgage that was taken out on this home.
Original Mortgage
$182,400
Interest Rate
6.79%
Mortgage Type
Purchase Money Mortgage
Create a Home Valuation Report for This Property
The Home Valuation Report is an in-depth analysis detailing your home's value as well as a comparison with similar homes in the area
Home Values in the Area
Average Home Value in this Area
Purchase History
| Date | Buyer | Sale Price | Title Company |
|---|---|---|---|
| Borowski Alan | $228,000 | -- |
Source: Public Records
Mortgage History
| Date | Status | Borrower | Loan Amount |
|---|---|---|---|
| Open | Borowski Alan | $160,000 | |
| Closed | Borowski Alan | $33,000 | |
| Closed | Borowski Alan | $182,400 |
Source: Public Records
Tax History Compared to Growth
Tax History
| Year | Tax Paid | Tax Assessment Tax Assessment Total Assessment is a certain percentage of the fair market value that is determined by local assessors to be the total taxable value of land and additions on the property. | Land | Improvement |
|---|---|---|---|---|
| 2025 | $5,310 | $383,700 | $152,200 | $231,500 |
| 2024 | $5,233 | $341,800 | $132,700 | $209,100 |
| 2023 | $4,427 | $328,400 | $126,100 | $202,300 |
| 2022 | $4,187 | $306,300 | $119,600 | $186,700 |
| 2021 | $4,192 | $295,400 | $108,700 | $186,700 |
| 2020 | $3,997 | $295,400 | $108,700 | $186,700 |
| 2019 | $3,554 | $255,900 | $106,600 | $149,300 |
| 2018 | $3,512 | $258,600 | $106,600 | $152,000 |
| 2017 | $3,454 | $261,300 | $106,600 | $154,700 |
| 2016 | $3,444 | $261,300 | $106,600 | $154,700 |
| 2015 | $3,196 | $242,700 | $95,700 | $147,000 |
| 2014 | $3,090 | $243,900 | $95,700 | $148,200 |
Source: Public Records
Map
Nearby Homes
- 18 Elm St
- 34 Gore Ave
- 58 Main St Unit 4
- 58 Main St Unit 3
- 0 Straits Rd
- 136 Main St
- 21 Dwight St
- 121 West St
- 12 Dwight St
- 2B Linseed Rd
- 0 Pantry Rd Unit 73430264
- 43 Laurel Park Unit 43
- 66 Laurel Park Unit 66
- 93 Laurel Park Unit 93
- 11 West St
- 0 N Branch Rd
- 32 Stonewall Dr
- 147 Pantry Rd
- 182 Old Stage Rd
- 151 Pantry Rd
- 65 Prospect St
- 65 Prospect St Unit 1
- 74 Prospect St
- 35 Chestnut St
- 70 Prospect St
- 37 Chestnut St
- 68 Prospect St
- 68 Prospect St Unit 1
- 27 Chestnut St
- 59 Prospect St
- 23 Chestnut St
- 9 Raymond Ave
- 66 Prospect St
- 80 Prospect St
- 39 Chestnut St
- 64 Prospect St
- 28 Chestnut St
- 21 Chestnut St
- 34 Chestnut St
- 5 Raymond Ave