71 S James Rd Columbus, OH 43213
Eastmoor NeighborhoodEstimated Value: $240,000 - $335,961
4
Beds
2
Baths
1,652
Sq Ft
$169/Sq Ft
Est. Value
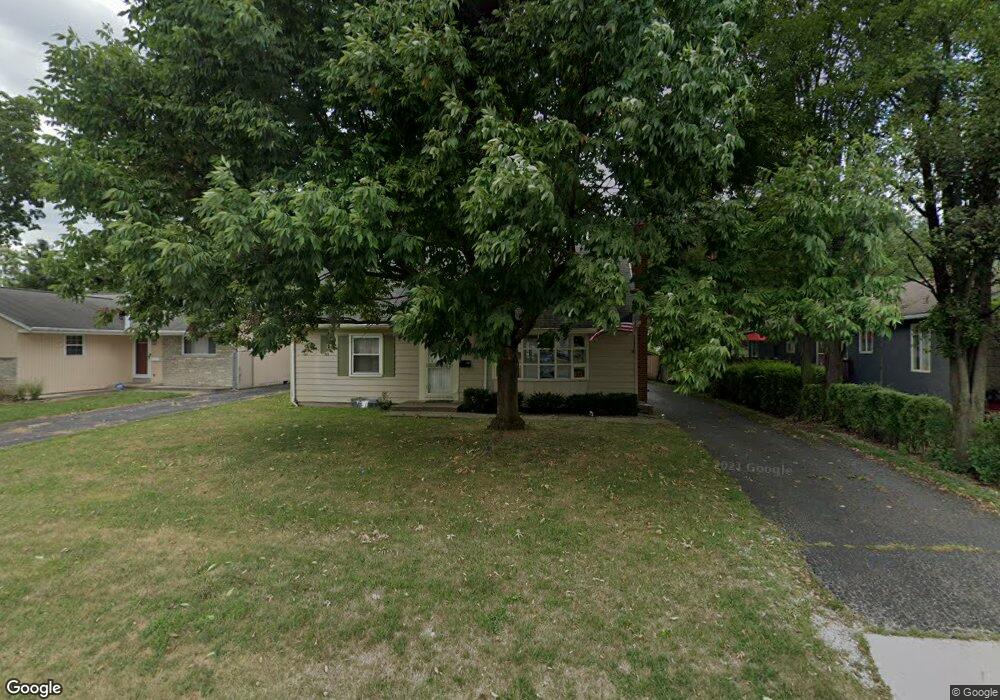
About This Home
This home is located at 71 S James Rd, Columbus, OH 43213 and is currently estimated at $279,990, approximately $169 per square foot. 71 S James Rd is a home located in Franklin County with nearby schools including Fairmoor Elementary School, Johnson Park Middle School, and Walnut Ridge High School.
Ownership History
Date
Name
Owned For
Owner Type
Purchase Details
Closed on
Apr 18, 2022
Sold by
Daniel Laverack
Bought by
Laverack Daniel E and Laverack Toni M
Current Estimated Value
Purchase Details
Closed on
Sep 29, 2016
Sold by
Serrano Rigoberto and Serrano Maria
Bought by
Laverack Daniel
Home Financials for this Owner
Home Financials are based on the most recent Mortgage that was taken out on this home.
Original Mortgage
$120,000
Interest Rate
3.46%
Mortgage Type
New Conventional
Purchase Details
Closed on
Jul 15, 2009
Sold by
Ray Judith L and Barbara V Winkler Trust
Bought by
Serrano Rigoberto
Home Financials for this Owner
Home Financials are based on the most recent Mortgage that was taken out on this home.
Original Mortgage
$88,217
Interest Rate
5.62%
Mortgage Type
FHA
Purchase Details
Closed on
Jun 3, 2005
Sold by
Winkler Barbara V
Bought by
Winkler Barbara V and The Barbara V Winkler Trust
Create a Home Valuation Report for This Property
The Home Valuation Report is an in-depth analysis detailing your home's value as well as a comparison with similar homes in the area
Home Values in the Area
Average Home Value in this Area
Purchase History
| Date | Buyer | Sale Price | Title Company |
|---|---|---|---|
| Laverack Daniel E | -- | Rosenthal Lee S | |
| Laverack Daniel | $120,000 | None Available | |
| Serrano Rigoberto | $89,900 | Talon Group | |
| Winkler Barbara V | -- | -- |
Source: Public Records
Mortgage History
| Date | Status | Borrower | Loan Amount |
|---|---|---|---|
| Previous Owner | Laverack Daniel | $120,000 | |
| Previous Owner | Serrano Rigoberto | $88,217 |
Source: Public Records
Tax History Compared to Growth
Tax History
| Year | Tax Paid | Tax Assessment Tax Assessment Total Assessment is a certain percentage of the fair market value that is determined by local assessors to be the total taxable value of land and additions on the property. | Land | Improvement |
|---|---|---|---|---|
| 2024 | $4,220 | $94,020 | $41,900 | $52,120 |
| 2023 | $4,166 | $94,010 | $41,895 | $52,115 |
| 2022 | $2,585 | $49,850 | $20,340 | $29,510 |
| 2021 | $2,590 | $49,850 | $20,340 | $29,510 |
| 2020 | $2,593 | $49,850 | $20,340 | $29,510 |
| 2019 | $2,289 | $37,740 | $16,280 | $21,460 |
| 2018 | $2,223 | $37,740 | $16,280 | $21,460 |
| 2017 | $2,335 | $37,740 | $16,280 | $21,460 |
| 2016 | $2,381 | $35,950 | $6,830 | $29,120 |
| 2015 | $2,162 | $35,950 | $6,830 | $29,120 |
| 2014 | $2,167 | $35,950 | $6,830 | $29,120 |
| 2013 | $1,069 | $35,945 | $6,825 | $29,120 |
Source: Public Records
Map
Nearby Homes
- 247 S James Rd
- 239 S Kellner Rd
- 46 N Everett Ave
- 73 N Everett Ave
- 277 S James Rd
- 50 S Chesterfield Rd
- 3235 Maryland Ave
- 201 S Weyant Ave
- 94 N Hampton Rd
- 178 S Weyant Ave
- 47 N Chesterfield Rd
- 50 N Broadleigh Rd
- 88-90 N Waverly St
- 238 Edgevale Rd
- 253 N James Rd
- 177 N James Rd
- 243 N James Rd
- 142 S Gould Rd
- 430 S James Rd
- 91 Maplewood Ave