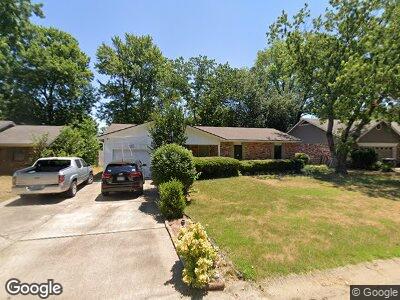
71 Sherwood Loop Searcy, AR 72143
Estimated Value: $137,823 - $163,000
--
Bed
2
Baths
1,266
Sq Ft
$122/Sq Ft
Est. Value
About This Home
This home is located at 71 Sherwood Loop, Searcy, AR 72143 and is currently estimated at $153,956, approximately $121 per square foot. 71 Sherwood Loop is a home located in White County with nearby schools including Westside Elementary School, Southwest Middle School, and Ahlf Junior High School.
Ownership History
Date
Name
Owned For
Owner Type
Purchase Details
Closed on
Jul 10, 2006
Sold by
Morton Mary Wynn
Bought by
Morton Robert Edward
Current Estimated Value
Home Financials for this Owner
Home Financials are based on the most recent Mortgage that was taken out on this home.
Original Mortgage
$85,500
Interest Rate
6.66%
Mortgage Type
New Conventional
Purchase Details
Closed on
Jul 14, 2003
Bought by
Morton
Purchase Details
Closed on
Dec 1, 1996
Bought by
Graham Stephen C
Purchase Details
Closed on
Aug 1, 1987
Bought by
Neaville Charles K and Neaville Susan G
Purchase Details
Closed on
Sep 1, 1984
Bought by
Benbrook James G
Purchase Details
Closed on
Mar 1, 1984
Bought by
Knight Zettie Jones
Create a Home Valuation Report for This Property
The Home Valuation Report is an in-depth analysis detailing your home's value as well as a comparison with similar homes in the area
Home Values in the Area
Average Home Value in this Area
Purchase History
| Date | Buyer | Sale Price | Title Company |
|---|---|---|---|
| Morton Robert Edward | -- | None Available | |
| Morton | $77,000 | -- | |
| Graham Stephen C | $66,000 | -- | |
| Neaville Charles K | $51,000 | -- | |
| Benbrook James G | $49,000 | -- | |
| Knight Zettie Jones | $47,300 | -- |
Source: Public Records
Mortgage History
| Date | Status | Borrower | Loan Amount |
|---|---|---|---|
| Open | Morton Robert | $80,000 | |
| Closed | Morton Robert E | $25,125 | |
| Closed | Morton Robert Edward | $90,811 | |
| Closed | Morton Robert Edward | $85,500 | |
| Closed | Morton Robert Edward | $4,128 |
Source: Public Records
Tax History Compared to Growth
Tax History
| Year | Tax Paid | Tax Assessment Tax Assessment Total Assessment is a certain percentage of the fair market value that is determined by local assessors to be the total taxable value of land and additions on the property. | Land | Improvement |
|---|---|---|---|---|
| 2024 | $812 | $20,010 | $6,600 | $13,410 |
| 2023 | $387 | $20,010 | $6,600 | $13,410 |
| 2022 | $437 | $20,010 | $6,600 | $13,410 |
| 2021 | $423 | $20,010 | $6,600 | $13,410 |
| 2020 | $385 | $18,710 | $5,800 | $12,910 |
| 2019 | $385 | $18,710 | $5,800 | $12,910 |
| 2018 | $410 | $18,710 | $5,800 | $12,910 |
| 2017 | $756 | $18,710 | $5,800 | $12,910 |
| 2016 | $756 | $18,610 | $5,800 | $12,810 |
| 2015 | $719 | $17,720 | $5,400 | $12,320 |
| 2014 | $719 | $17,720 | $5,400 | $12,320 |
Source: Public Records
Map
Nearby Homes
- 2405 Audley Bolton Dr
- 34 Sherwood Loop
- 0 W Beebe Capps Expy Unit 22023380
- 305 Crain Dr
- 304 Country Squire Ln
- 300 N Sawmill Rd
- 105 Nicole Dr
- 408 Crain Dr
- 423 E Palmer Ct
- 412 Country Squire Ln
- 408 S Sawmill Rd
- 6 Palmer Ct
- 42 Robbye Ln
- 7 Samantha Cir
- 111 Woodlane Dr
- 214 Hermitage Dr
- 514 S Sawmill Rd
- 6 Meadow Lane Dr
- 505 Wycliffe Dr
- 3 Julner Dr
- 71 Sherwood Loop
- 69 Sherwood Loop Unit West Searcy in Cedar
- 73 Sherwood Loop
- 5 Overlook Rd
- 7 Overlook Rd
- 3 Overlook Rd
- 67 Sherwood Loop
- 75 Sherwood Loop
- 74 Sherwood Loop
- 72 Sherwood Loop
- 1 Overlook Rd
- 9 Overlook Rd
- 76 Sherwood Loop
- 70 Sherwood Loop
- 65 Sherwood Loop
- 78 Sherwood Loop
- 11 Overlook Rd
- 68 Sherwood Loop
- 10 Overlook Rd
- 214 Joy Dr