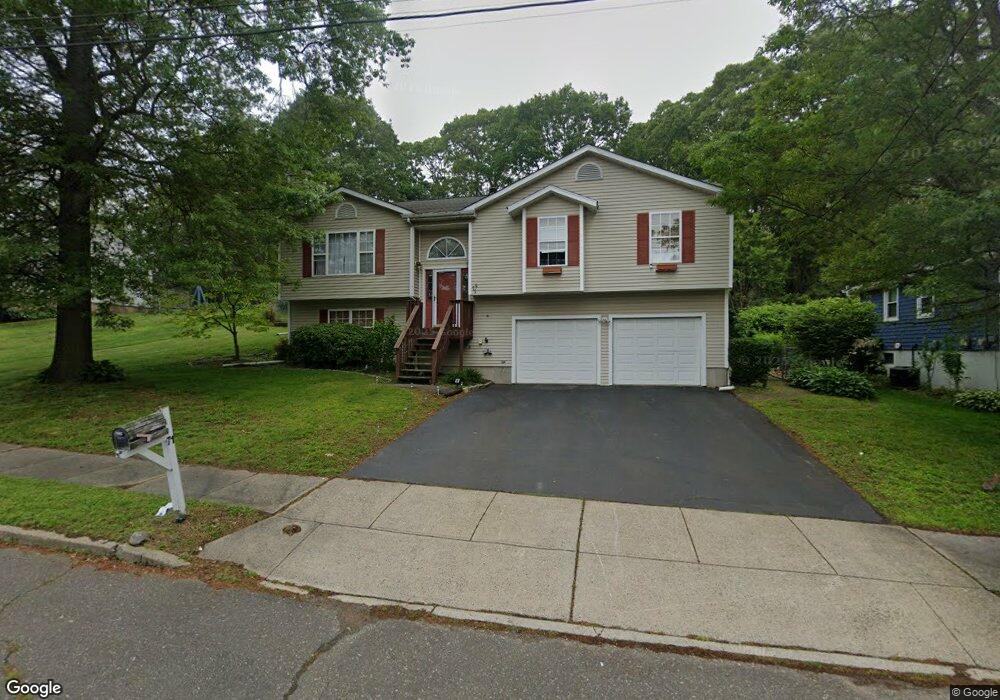
71 Sorenson Rd West Haven, CT 06516
West Shore NeighborhoodEstimated Value: $439,000 - $525,000
3
Beds
3
Baths
1,332
Sq Ft
$352/Sq Ft
Est. Value
About This Home
This home is located at 71 Sorenson Rd, West Haven, CT 06516 and is currently estimated at $468,305, approximately $351 per square foot. 71 Sorenson Rd is a home located in New Haven County with nearby schools including Carrigan 5/6 Intermediate School, Harry M. Bailey Middle School, and West Haven High School.
Ownership History
Date
Name
Owned For
Owner Type
Purchase Details
Closed on
Sep 24, 2024
Sold by
Sheng Ping
Bought by
Sheng Ping and Chen Jiantao
Current Estimated Value
Purchase Details
Closed on
Mar 18, 2019
Sold by
Xiong Shijung
Bought by
Sheng Ping
Purchase Details
Closed on
Jun 7, 2011
Sold by
Sheng Ping
Bought by
Xiong Shijing and Sheng Ping
Purchase Details
Closed on
Nov 29, 2006
Sold by
Carloni Barry P and Miler-Carloni Jennifer A
Bought by
Sheng Ping
Home Financials for this Owner
Home Financials are based on the most recent Mortgage that was taken out on this home.
Original Mortgage
$235,700
Interest Rate
6.36%
Mortgage Type
Purchase Money Mortgage
Purchase Details
Closed on
May 12, 1995
Sold by
Morehouse Hills Dev
Bought by
Carloni Barry P and Miller Jennifer A
Home Financials for this Owner
Home Financials are based on the most recent Mortgage that was taken out on this home.
Original Mortgage
$106,000
Interest Rate
8.75%
Mortgage Type
Purchase Money Mortgage
Purchase Details
Closed on
Jul 22, 1994
Sold by
Grammatico Robin M and Grammatico Holly A
Bought by
Morehouse Hill Dev
Create a Home Valuation Report for This Property
The Home Valuation Report is an in-depth analysis detailing your home's value as well as a comparison with similar homes in the area
Home Values in the Area
Average Home Value in this Area
Purchase History
| Date | Buyer | Sale Price | Title Company |
|---|---|---|---|
| Sheng Ping | -- | None Available | |
| Sheng Ping | -- | None Available | |
| Sheng Ping | -- | -- | |
| Sheng Ping | -- | -- | |
| Xiong Shijing | -- | -- | |
| Sheng Ping | $326,800 | -- | |
| Carloni Barry P | $132,500 | -- | |
| Morehouse Hill Dev | $25,000 | -- | |
| Xiong Shijing | -- | -- | |
| Sheng Ping | $326,800 | -- | |
| Carloni Barry P | $132,500 | -- | |
| Morehouse Hill Dev | $25,000 | -- |
Source: Public Records
Mortgage History
| Date | Status | Borrower | Loan Amount |
|---|---|---|---|
| Previous Owner | Morehouse Hill Dev | $235,700 | |
| Previous Owner | Morehouse Hill Dev | $106,000 |
Source: Public Records
Tax History
| Year | Tax Paid | Tax Assessment Tax Assessment Total Assessment is a certain percentage of the fair market value that is determined by local assessors to be the total taxable value of land and additions on the property. | Land | Improvement |
|---|---|---|---|---|
| 2025 | $10,009 | $289,870 | $85,540 | $204,330 |
| 2024 | $9,364 | $192,990 | $59,290 | $133,700 |
| 2023 | $8,976 | $192,990 | $59,290 | $133,700 |
| 2022 | $8,800 | $192,990 | $59,290 | $133,700 |
| 2021 | $8,800 | $192,990 | $59,290 | $133,700 |
| 2020 | $8,627 | $170,940 | $54,880 | $116,060 |
| 2019 | $8,320 | $170,940 | $54,880 | $116,060 |
| 2018 | $8,248 | $170,940 | $54,880 | $116,060 |
| 2017 | $7,805 | $170,940 | $54,880 | $116,060 |
| 2016 | $7,788 | $170,940 | $54,880 | $116,060 |
| 2015 | $7,491 | $185,640 | $58,520 | $127,120 |
| 2014 | $7,444 | $185,640 | $58,520 | $127,120 |
Source: Public Records
Map
Nearby Homes
- 16 Sorensen Rd
- 51 Woody Ln
- 70 Edward St
- 292 Richmond Ave
- 52 Saw Mill Rd
- 166 Saw Mill Rd
- 79 Claudia Dr Unit 354
- 206 Highland Ave
- 330 Savin Ave Unit 76
- 330 Savin Ave Unit 32
- 68 Eagle Place
- 44 Church St
- 84 Eileen Rd
- 155 Leete St
- 248 William St
- 74 Wilson Ave
- 99 Roosevelt Ave
- 53 Pheasant Rd
- 12 Linda St
- 327 Center St
- 63 Sorenson Rd
- 77 Sorenson Rd
- 57 Sorenson Rd
- 54 Sorenson Rd
- 58 Sorenson Rd
- 81 Sorenson Rd
- 62 Sorenson Rd
- 52 Sorenson Rd
- 51 Sorenson Rd
- 14 Elmhurst Terrace
- 55 Lawncrest Road Extension
- 43 Lawncrest Rd
- 59 Lawncrest Road Extension
- 48 Sorenson Rd
- 16 Elmhurst Terrace
- 15 Wildwood Terrace
- 23 Wildwood Terrace
- 31 Wildwood Terrace
- 39 Lawncrest Rd
- 11 Wildwood Terrace
Your Personal Tour Guide
Ask me questions while you tour the home.