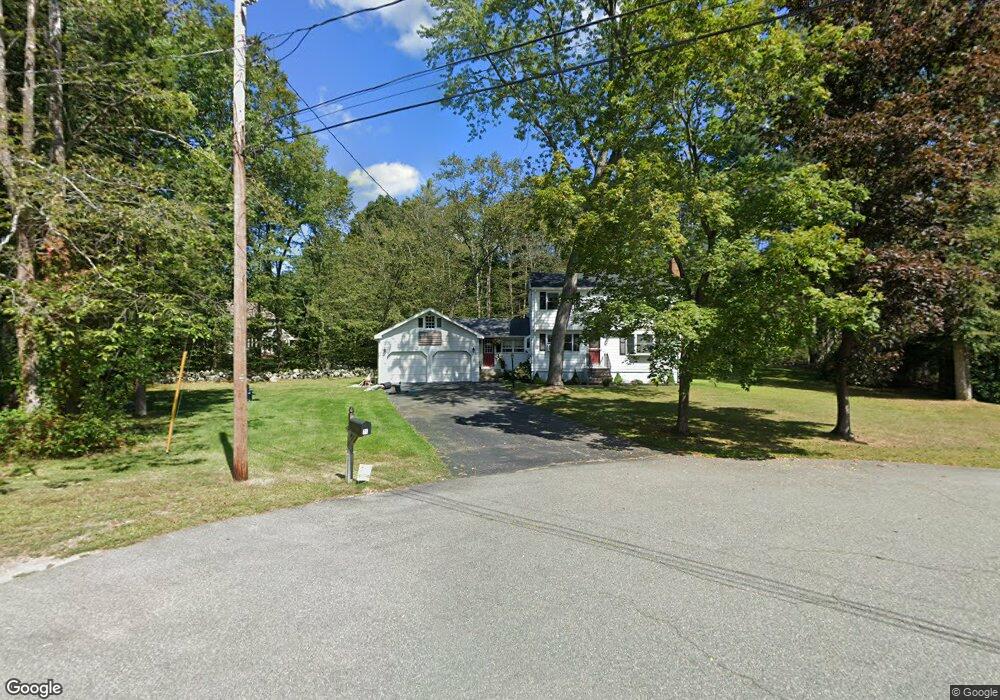
71 Vine St Hanover, MA 02339
Estimated Value: $752,000 - $849,000
5
Beds
2
Baths
1,726
Sq Ft
$450/Sq Ft
Est. Value
About This Home
This home is located at 71 Vine St, Hanover, MA 02339 and is currently estimated at $777,550, approximately $450 per square foot. 71 Vine St is a home located in Plymouth County with nearby schools including Hanover High School, Calvary Chapel Academy, and Holy Family Elementary School.
Ownership History
Date
Name
Owned For
Owner Type
Purchase Details
Closed on
Jan 4, 2025
Sold by
Furtado Dennis J and Furtado Kimberly A
Bought by
Furtado Joint Ret and Furtado
Current Estimated Value
Purchase Details
Closed on
Jun 26, 2001
Sold by
Jackson William F and Jackson Louise C
Bought by
Furtado Dennis J and Furtado Kimberly A
Home Financials for this Owner
Home Financials are based on the most recent Mortgage that was taken out on this home.
Original Mortgage
$67,000
Interest Rate
7.09%
Mortgage Type
Purchase Money Mortgage
Create a Home Valuation Report for This Property
The Home Valuation Report is an in-depth analysis detailing your home's value as well as a comparison with similar homes in the area
Home Values in the Area
Average Home Value in this Area
Purchase History
| Date | Buyer | Sale Price | Title Company |
|---|---|---|---|
| Furtado Joint Ret | -- | None Available | |
| Furtado Joint Ret | -- | None Available | |
| Furtado Joint Ret | -- | None Available | |
| Furtado Dennis J | $330,000 | -- | |
| Furtado Dennis J | $330,000 | -- |
Source: Public Records
Mortgage History
| Date | Status | Borrower | Loan Amount |
|---|---|---|---|
| Previous Owner | Furtado Dennis J | $100,000 | |
| Previous Owner | Furtado Dennis J | $68,000 | |
| Previous Owner | Furtado Dennis J | $67,000 |
Source: Public Records
Tax History Compared to Growth
Tax History
| Year | Tax Paid | Tax Assessment Tax Assessment Total Assessment is a certain percentage of the fair market value that is determined by local assessors to be the total taxable value of land and additions on the property. | Land | Improvement |
|---|---|---|---|---|
| 2025 | $7,536 | $610,200 | $279,900 | $330,300 |
| 2024 | $7,420 | $577,900 | $279,900 | $298,000 |
| 2023 | $6,875 | $509,600 | $254,600 | $255,000 |
| 2022 | $7,317 | $479,800 | $254,600 | $225,200 |
| 2021 | $7,184 | $439,900 | $231,500 | $208,400 |
| 2020 | $7,025 | $430,700 | $231,500 | $199,200 |
| 2019 | $6,854 | $417,700 | $231,500 | $186,200 |
| 2018 | $6,497 | $399,100 | $231,500 | $167,600 |
| 2017 | $6,294 | $381,000 | $215,300 | $165,700 |
| 2016 | $6,031 | $357,700 | $195,700 | $162,000 |
| 2015 | $5,777 | $357,700 | $195,700 | $162,000 |
Source: Public Records
Map
Nearby Homes
- 216 Whiting St
- 206-208 Hinghm St
- 141 Deerfield Ln
- 120 Deerfield Ln
- 436 E Water St
- 354 Webster St
- 18 Midfield Dr
- 507 Liberty St
- 118 Bates Way
- 83 Summit St
- 92 Liberty St
- 49 Liberty St
- 63 Webster St
- 45-47 Park St
- 440 Market St
- 3 Blueberry Ct
- 7 Boxberry Ln Unit 7
- 55 Turner Rd
- 718 Market St
- 737-739 Union St