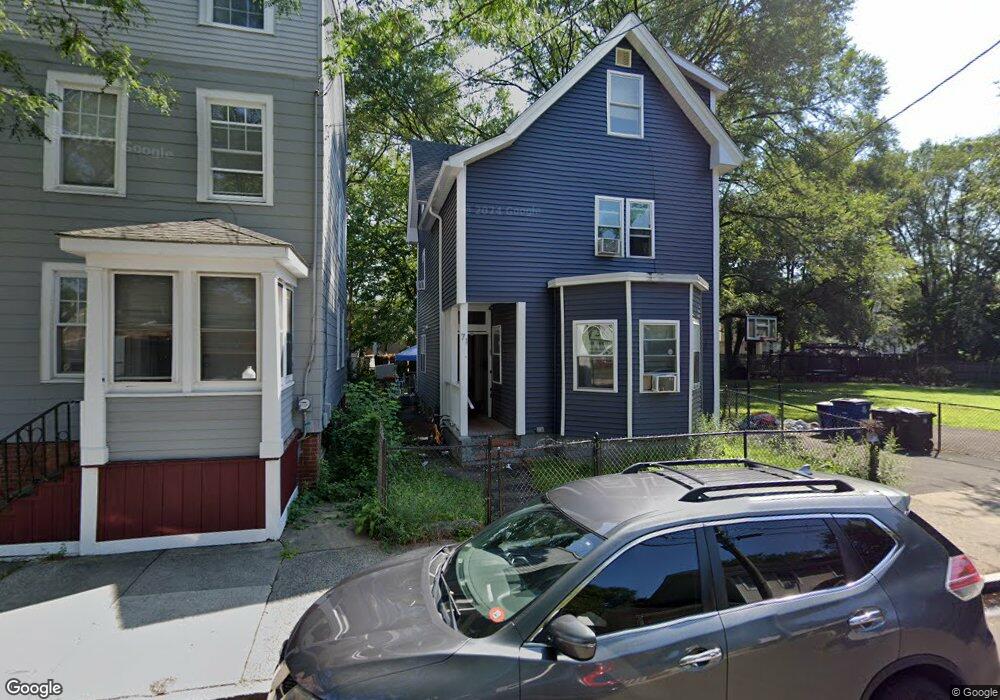
71 White St New Haven, CT 06519
The Hill NeighborhoodEstimated Value: $272,000 - $383,000
4
Beds
2
Baths
1,535
Sq Ft
$201/Sq Ft
Est. Value
About This Home
This home is located at 71 White St, New Haven, CT 06519 and is currently estimated at $309,137, approximately $201 per square foot. 71 White St is a home located in New Haven County with nearby schools including John C. Daniels and St Martin De Porres Academy.
Ownership History
Date
Name
Owned For
Owner Type
Purchase Details
Closed on
Apr 7, 2021
Sold by
Alpha Acquisitions Llc
Bought by
Alpha Acquisitions Llc
Current Estimated Value
Purchase Details
Closed on
Oct 7, 2020
Sold by
Edge Dannie W and New Haven City Of
Bought by
Alpha Acquisitions Llc
Purchase Details
Closed on
Mar 19, 1968
Bought by
Edge Dannie W and Edge Ella R
Create a Home Valuation Report for This Property
The Home Valuation Report is an in-depth analysis detailing your home's value as well as a comparison with similar homes in the area
Home Values in the Area
Average Home Value in this Area
Purchase History
| Date | Buyer | Sale Price | Title Company |
|---|---|---|---|
| Alpha Acquisitions Llc | -- | None Available | |
| Alpha Acquisitions Llc | $32,500 | None Available | |
| Edge Dannie W | -- | -- |
Source: Public Records
Tax History Compared to Growth
Tax History
| Year | Tax Paid | Tax Assessment Tax Assessment Total Assessment is a certain percentage of the fair market value that is determined by local assessors to be the total taxable value of land and additions on the property. | Land | Improvement |
|---|---|---|---|---|
| 2025 | $7,507 | $190,540 | $35,770 | $154,770 |
| 2024 | $7,336 | $190,540 | $35,770 | $154,770 |
| 2023 | $3,026 | $81,340 | $35,770 | $45,570 |
| 2022 | $3,233 | $81,340 | $35,770 | $45,570 |
| 2021 | $2,390 | $54,460 | $27,720 | $26,740 |
| 2020 | $2,390 | $54,460 | $27,720 | $26,740 |
| 2019 | $2,341 | $54,460 | $27,720 | $26,740 |
| 2018 | $2,341 | $54,460 | $27,720 | $26,740 |
| 2017 | $2,107 | $54,460 | $27,720 | $26,740 |
| 2016 | $1,530 | $36,820 | $10,710 | $26,110 |
| 2015 | $1,530 | $36,820 | $10,710 | $26,110 |
| 2014 | $1,530 | $36,820 | $10,710 | $26,110 |
Source: Public Records
Map
Nearby Homes
- 29 White St
- 467 Columbus Ave
- 72 Daggett St
- 56 Ann St
- 262 Davenport Ave
- 45 Frank St
- 247 Davenport Ave
- 312 Davenport Ave
- 43 Elliott St
- 57 Stevens St
- 84 Sylvan Ave
- 65 Stevens St
- 201 Portsea St
- 533 Howard Ave
- 194 Ella T Grasso Blvd
- 31 Greenwood St
- 46 Liberty St
- 129 Winthrop Ave
- 51 Arthur St
- 33 Liberty St Unit M