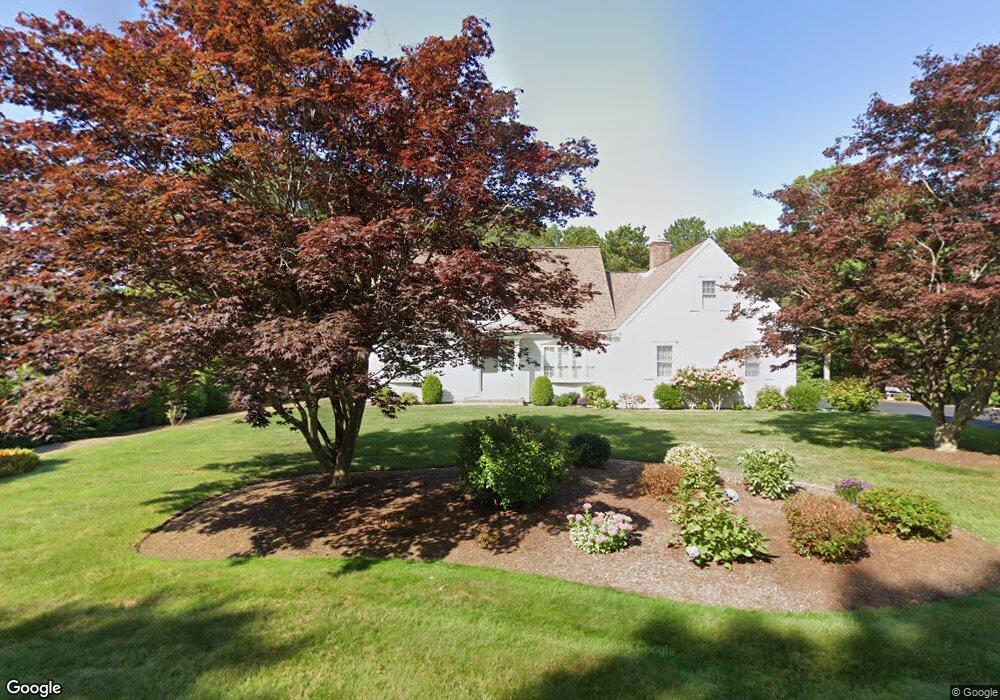
71 Whitmar Rd Cotuit, MA 02635
Cotuit NeighborhoodEstimated Value: $925,725 - $1,098,000
3
Beds
3
Baths
2,189
Sq Ft
$469/Sq Ft
Est. Value
About This Home
This home is located at 71 Whitmar Rd, Cotuit, MA 02635 and is currently estimated at $1,027,681, approximately $469 per square foot. 71 Whitmar Rd is a home located in Barnstable County with nearby schools including West Villages Elementary School, Barnstable United Elementary School, and Barnstable Intermediate School.
Ownership History
Date
Name
Owned For
Owner Type
Purchase Details
Closed on
Nov 1, 2016
Sold by
Boulos Frances
Bought by
Whitmar Road Irt
Current Estimated Value
Purchase Details
Closed on
Mar 9, 2004
Sold by
Cannavo Constance and Cannavo John
Bought by
Cannavo Frances
Purchase Details
Closed on
May 20, 1994
Sold by
Cordwood Rt and Callahan John R
Bought by
Cannavo John and Cannavo Constance
Create a Home Valuation Report for This Property
The Home Valuation Report is an in-depth analysis detailing your home's value as well as a comparison with similar homes in the area
Home Values in the Area
Average Home Value in this Area
Purchase History
| Date | Buyer | Sale Price | Title Company |
|---|---|---|---|
| Whitmar Road Irt | -- | -- | |
| Cannavo Frances | -- | -- | |
| Cannavo John | $65,000 | -- |
Source: Public Records
Tax History
| Year | Tax Paid | Tax Assessment Tax Assessment Total Assessment is a certain percentage of the fair market value that is determined by local assessors to be the total taxable value of land and additions on the property. | Land | Improvement |
|---|---|---|---|---|
| 2025 | $7,245 | $867,700 | $203,000 | $664,700 |
| 2024 | $6,501 | $825,000 | $203,000 | $622,000 |
| 2023 | $6,302 | $752,900 | $200,600 | $552,300 |
| 2022 | $6,331 | $612,300 | $142,700 | $469,600 |
| 2021 | $6,055 | $548,400 | $142,700 | $405,700 |
| 2020 | $6,073 | $518,600 | $152,100 | $366,500 |
| 2019 | $5,686 | $478,600 | $152,100 | $326,500 |
| 2018 | $5,378 | $452,700 | $166,800 | $285,900 |
| 2017 | $5,183 | $439,200 | $166,800 | $272,400 |
| 2016 | $5,107 | $443,700 | $171,300 | $272,400 |
| 2015 | $4,828 | $419,100 | $158,800 | $260,300 |
Source: Public Records
Map
Nearby Homes
- 15 Geraldine Rd
- 1415 Old Post Rd
- 602 Putnam Ave
- 165 Baxter Neck Rd
- 240 Baxters Neck Rd
- 564 Cotuit Bay Dr
- 564 Cotuit Bay Dr
- 1456 Santuit-Newtown Rd
- 68 Hilltop Dr
- 359 Baxter Neck Rd
- 1597 Santuit-Newtown Rd
- 78 Brittany Dr
- 835 Old Post Rd
- 170 Forest Hills Rd
- 1820 Santuit Newtown Rd
- 75 Bob White Run
- 280 Ice Valley Rd
- 71 Sand Point
- 552 Main St
- 244 Wakeby Rd
Your Personal Tour Guide
Ask me questions while you tour the home.