710 7th St SW Cedar Rapids, IA 52404
Taylor NeighborhoodEstimated Value: $191,000 - $213,000
3
Beds
1
Bath
1,332
Sq Ft
$149/Sq Ft
Est. Value
About This Home
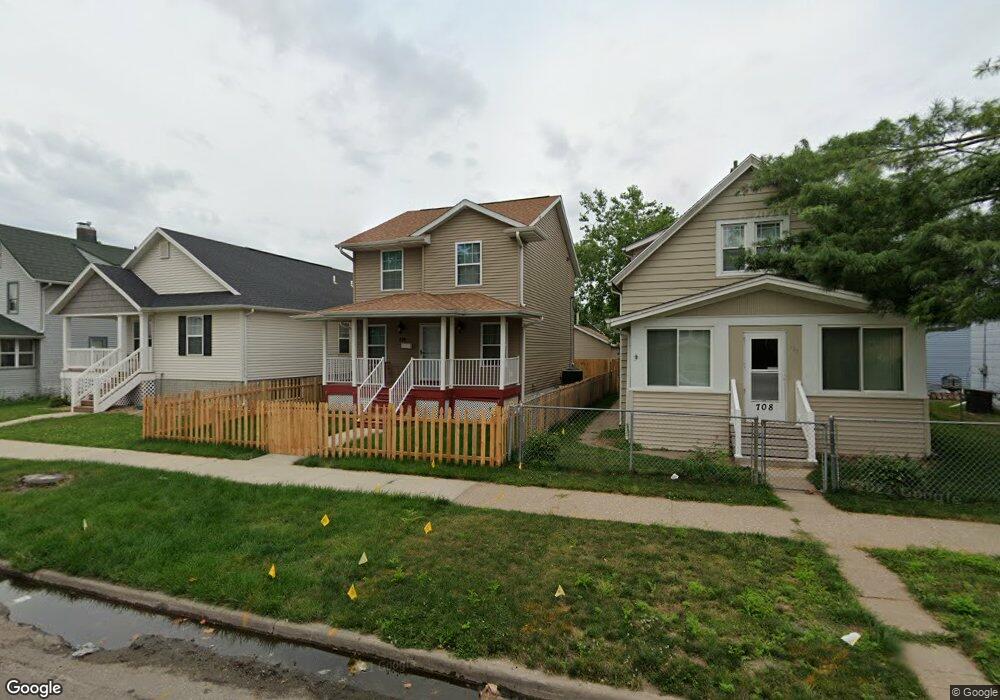
This home is located at 710 7th St SW, Cedar Rapids, IA 52404 and is currently estimated at $198,807, approximately $149 per square foot. 710 7th St SW is a home with nearby schools including Junction City Elementary School, Cedar River Academy at Taylor Elementary School, and Bruce Hall Day Treatment Center.
Ownership History
Date
Name
Owned For
Owner Type
Purchase Details
Closed on
Apr 8, 2015
Sold by
Neighborhood Development Corp Of Cedar R
Bought by
Franklin Ernest
Current Estimated Value
Home Financials for this Owner
Home Financials are based on the most recent Mortgage that was taken out on this home.
Original Mortgage
$112,121
Outstanding Balance
$86,409
Interest Rate
3.85%
Mortgage Type
FHA
Estimated Equity
$112,398
Purchase Details
Closed on
Aug 16, 2010
Sold by
Mcnamara Oil Co Inc
Bought by
City Of Cedar Rapids
Purchase Details
Closed on
Jan 2, 1998
Sold by
Chusco Investment Corp
Bought by
Mcnamara Oil Co Inc
Create a Home Valuation Report for This Property
The Home Valuation Report is an in-depth analysis detailing your home's value as well as a comparison with similar homes in the area
Home Values in the Area
Average Home Value in this Area
Purchase History
| Date | Buyer | Sale Price | Title Company |
|---|---|---|---|
| Franklin Ernest | $147,000 | None Available | |
| City Of Cedar Rapids | $80,000 | None Available | |
| Mcnamara Oil Co Inc | -- | -- |
Source: Public Records
Mortgage History
| Date | Status | Borrower | Loan Amount |
|---|---|---|---|
| Open | Franklin Ernest | $112,121 | |
| Closed | Franklin Ernest | $36,731 |
Source: Public Records
Tax History Compared to Growth
Tax History
| Year | Tax Paid | Tax Assessment Tax Assessment Total Assessment is a certain percentage of the fair market value that is determined by local assessors to be the total taxable value of land and additions on the property. | Land | Improvement |
|---|---|---|---|---|
| 2025 | $3,006 | $200,300 | $19,700 | $180,600 |
| 2024 | $3,316 | $180,300 | $17,300 | $163,000 |
| 2023 | $3,316 | $180,300 | $17,300 | $163,000 |
| 2022 | $2,888 | $166,100 | $15,000 | $151,100 |
| 2021 | $3,022 | $148,400 | $15,000 | $133,400 |
| 2020 | $3,022 | $145,600 | $11,800 | $133,800 |
| 2019 | $2,850 | $140,700 | $11,800 | $128,900 |
| 2018 | $2,766 | $140,700 | $11,800 | $128,900 |
| 2017 | $2,766 | $131,100 | $11,800 | $119,300 |
| 2016 | $2,005 | $94,300 | $11,800 | $82,500 |
| 2015 | $302 | $14,175 | $14,175 | $0 |
| 2014 | $302 | $13,500 | $13,500 | $0 |
| 2013 | $282 | $13,500 | $13,500 | $0 |
Source: Public Records
Map
Nearby Homes