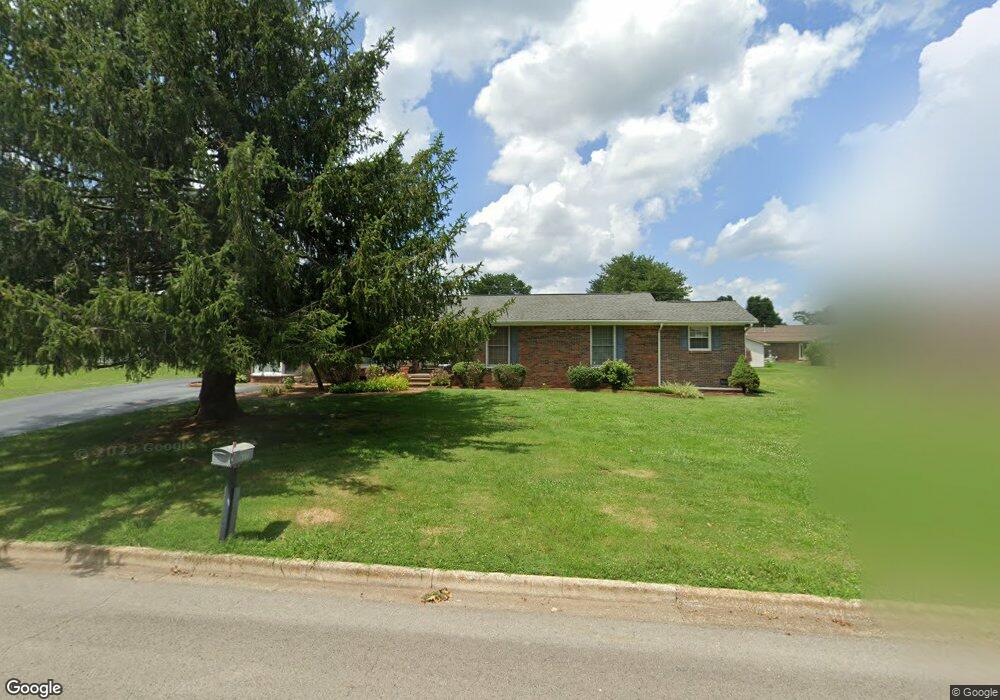
710 9th St Lawrenceburg, TN 38464
Estimated Value: $218,255 - $295,000
--
Bed
1
Bath
1,868
Sq Ft
$135/Sq Ft
Est. Value
About This Home
This home is located at 710 9th St, Lawrenceburg, TN 38464 and is currently estimated at $251,814, approximately $134 per square foot. 710 9th St is a home located in Lawrence County with nearby schools including Ingram Sowell Elementary School, Lawrenceburg Public Elementary School, and David Crockett Elementary School.
Ownership History
Date
Name
Owned For
Owner Type
Purchase Details
Closed on
Dec 28, 2016
Sold by
Chandler Roger
Bought by
Chandler Roger and Chandler Joanna
Current Estimated Value
Home Financials for this Owner
Home Financials are based on the most recent Mortgage that was taken out on this home.
Original Mortgage
$66,702
Outstanding Balance
$54,771
Interest Rate
4.08%
Mortgage Type
New Conventional
Estimated Equity
$197,043
Purchase Details
Closed on
Sep 14, 2007
Sold by
Richard Shrader
Bought by
Shrader Richard F
Purchase Details
Closed on
Mar 14, 1994
Sold by
James Wallace
Bought by
Roger Chandler
Purchase Details
Closed on
Mar 12, 1994
Bought by
Chandler Roger
Purchase Details
Closed on
Mar 29, 1978
Bought by
Wallace James L and Wallace Augusta
Create a Home Valuation Report for This Property
The Home Valuation Report is an in-depth analysis detailing your home's value as well as a comparison with similar homes in the area
Home Values in the Area
Average Home Value in this Area
Purchase History
| Date | Buyer | Sale Price | Title Company |
|---|---|---|---|
| Chandler Roger | -- | -- | |
| Shrader Richard F | -- | -- | |
| Roger Chandler | -- | -- | |
| Chandler Roger | $73,000 | -- | |
| Wallace James L | -- | -- |
Source: Public Records
Mortgage History
| Date | Status | Borrower | Loan Amount |
|---|---|---|---|
| Open | Chandler Roger | $66,702 |
Source: Public Records
Tax History Compared to Growth
Tax History
| Year | Tax Paid | Tax Assessment Tax Assessment Total Assessment is a certain percentage of the fair market value that is determined by local assessors to be the total taxable value of land and additions on the property. | Land | Improvement |
|---|---|---|---|---|
| 2025 | $1,367 | $43,975 | $0 | $0 |
| 2024 | $1,367 | $43,975 | $5,000 | $38,975 |
| 2023 | $1,367 | $43,975 | $5,000 | $38,975 |
| 2022 | $1,367 | $43,975 | $5,000 | $38,975 |
| 2021 | $1,038 | $23,625 | $3,750 | $19,875 |
| 2020 | $1,038 | $23,625 | $3,750 | $19,875 |
| 2019 | $1,038 | $23,625 | $3,750 | $19,875 |
| 2018 | $1,038 | $23,625 | $3,750 | $19,875 |
| 2017 | $1,038 | $23,625 | $3,750 | $19,875 |
| 2016 | $1,038 | $23,625 | $3,750 | $19,875 |
| 2015 | $983 | $23,625 | $3,750 | $19,875 |
| 2014 | $868 | $20,850 | $2,500 | $18,350 |
Source: Public Records
Map
Nearby Homes