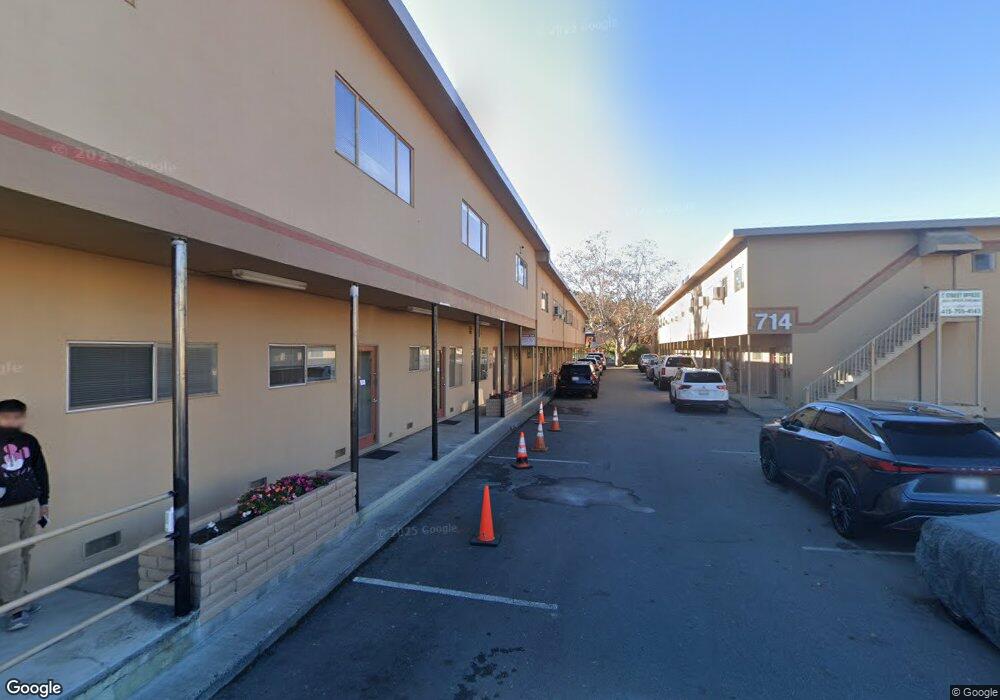
710 C St Unit 7A San Rafael, CA 94901
Gerstle Park NeighborhoodEstimated Value: $6,972,648
Studio
3
Baths
24,160
Sq Ft
$289/Sq Ft
Est. Value
About This Home
This home is located at 710 C St Unit 7A, San Rafael, CA 94901 and is currently estimated at $6,972,648, approximately $288 per square foot. 710 C St Unit 7A is a home located in Marin County with nearby schools including Laurel Dell Elementary School, James B. Davidson Middle School, and San Rafael High School.
Ownership History
Date
Name
Owned For
Owner Type
Purchase Details
Closed on
Dec 12, 2012
Sold by
Still Eduard and Still Janice
Bought by
Kramer Jerry R and Kramer Joan N
Current Estimated Value
Home Financials for this Owner
Home Financials are based on the most recent Mortgage that was taken out on this home.
Original Mortgage
$1,100,000
Outstanding Balance
$762,120
Interest Rate
3.37%
Mortgage Type
Commercial
Estimated Equity
$6,210,528
Purchase Details
Closed on
Nov 6, 1995
Sold by
Rainbow Investment Company
Bought by
Still Eduard and Still Janice
Home Financials for this Owner
Home Financials are based on the most recent Mortgage that was taken out on this home.
Original Mortgage
$850,000
Interest Rate
7.42%
Mortgage Type
Seller Take Back
Create a Home Valuation Report for This Property
The Home Valuation Report is an in-depth analysis detailing your home's value as well as a comparison with similar homes in the area
Home Values in the Area
Average Home Value in this Area
Purchase History
| Date | Buyer | Sale Price | Title Company |
|---|---|---|---|
| Kramer Jerry R | $3,100,000 | Old Republic Title Company | |
| Still Eduard | -- | Pacific Coast Title Company |
Source: Public Records
Mortgage History
| Date | Status | Borrower | Loan Amount |
|---|---|---|---|
| Open | Kramer Jerry R | $1,100,000 | |
| Previous Owner | Still Eduard | $850,000 |
Source: Public Records
Tax History
| Year | Tax Paid | Tax Assessment Tax Assessment Total Assessment is a certain percentage of the fair market value that is determined by local assessors to be the total taxable value of land and additions on the property. | Land | Improvement |
|---|---|---|---|---|
| 2025 | $63,879 | $3,817,278 | $1,600,794 | $2,216,484 |
| 2024 | $57,090 | $3,742,444 | $1,569,412 | $2,173,032 |
| 2023 | $53,488 | $3,669,067 | $1,538,641 | $2,130,426 |
| 2022 | $54,094 | $3,597,147 | $1,508,481 | $2,088,666 |
| 2021 | $50,747 | $3,526,622 | $1,478,906 | $2,047,716 |
| 2020 | $49,616 | $3,490,476 | $1,463,748 | $2,026,728 |
| 2019 | $46,138 | $3,422,059 | $1,435,057 | $1,987,002 |
| 2018 | $45,749 | $3,354,975 | $1,406,925 | $1,948,050 |
| 2017 | $43,904 | $3,289,193 | $1,379,339 | $1,909,854 |
| 2016 | $43,335 | $3,224,713 | $1,352,299 | $1,872,414 |
| 2015 | $42,312 | $3,176,291 | $1,331,993 | $1,844,298 |
| 2014 | $39,136 | $3,114,074 | $1,305,902 | $1,808,172 |
Source: Public Records
Map
Nearby Homes
Your Personal Tour Guide
Ask me questions while you tour the home.