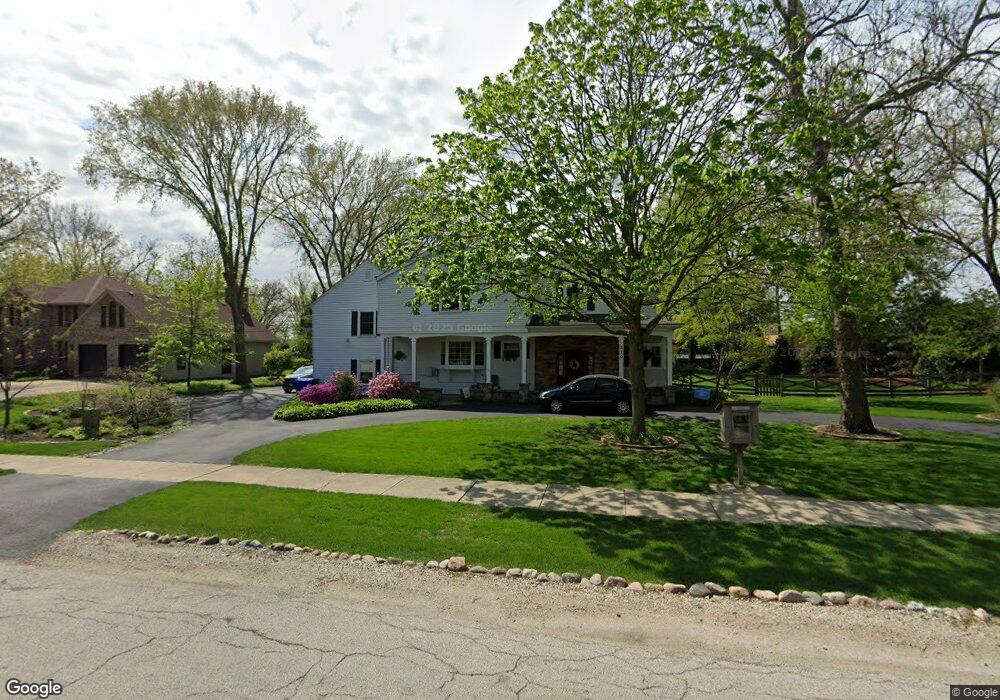
710 Dawes Ave Wheaton, IL 60189
Southeast Wheaton NeighborhoodEstimated Value: $617,000 - $789,000
4
Beds
3
Baths
3,280
Sq Ft
$215/Sq Ft
Est. Value
About This Home
This home is located at 710 Dawes Ave, Wheaton, IL 60189 and is currently estimated at $704,178, approximately $214 per square foot. 710 Dawes Ave is a home located in DuPage County with nearby schools including Lincoln Elementary School, Edison Middle School, and Wheaton Warrenville South High School.
Ownership History
Date
Name
Owned For
Owner Type
Purchase Details
Closed on
Sep 20, 2002
Sold by
Carlucci Frank C and Carlucci Yvette R
Bought by
Cendant Mobility Financial Corp
Current Estimated Value
Home Financials for this Owner
Home Financials are based on the most recent Mortgage that was taken out on this home.
Original Mortgage
$420,000
Interest Rate
5.37%
Purchase Details
Closed on
Sep 17, 2002
Sold by
Cendant Mobility Financial Corp
Bought by
Shorney Scott and Shorney Susan
Home Financials for this Owner
Home Financials are based on the most recent Mortgage that was taken out on this home.
Original Mortgage
$420,000
Interest Rate
5.37%
Purchase Details
Closed on
Sep 30, 1998
Sold by
Kincaid John B
Bought by
Carlucci Frank C and Carlucci Yvette R
Home Financials for this Owner
Home Financials are based on the most recent Mortgage that was taken out on this home.
Original Mortgage
$331,200
Interest Rate
6.8%
Create a Home Valuation Report for This Property
The Home Valuation Report is an in-depth analysis detailing your home's value as well as a comparison with similar homes in the area
Home Values in the Area
Average Home Value in this Area
Purchase History
| Date | Buyer | Sale Price | Title Company |
|---|---|---|---|
| Cendant Mobility Financial Corp | $489,000 | First American Title | |
| Shorney Scott | $489,000 | First American Title | |
| Carlucci Frank C | $368,000 | -- |
Source: Public Records
Mortgage History
| Date | Status | Borrower | Loan Amount |
|---|---|---|---|
| Previous Owner | Shorney Scott | $420,000 | |
| Previous Owner | Carlucci Frank C | $331,200 |
Source: Public Records
Tax History
| Year | Tax Paid | Tax Assessment Tax Assessment Total Assessment is a certain percentage of the fair market value that is determined by local assessors to be the total taxable value of land and additions on the property. | Land | Improvement |
|---|---|---|---|---|
| 2024 | $12,439 | $202,027 | $55,102 | $146,925 |
| 2023 | $11,962 | $185,010 | $50,720 | $134,290 |
| 2022 | $11,693 | $174,840 | $47,930 | $126,910 |
| 2021 | $11,656 | $170,690 | $46,790 | $123,900 |
| 2020 | $11,621 | $169,100 | $46,350 | $122,750 |
| 2019 | $11,357 | $164,640 | $45,130 | $119,510 |
| 2018 | $13,260 | $189,070 | $42,530 | $146,540 |
| 2017 | $13,069 | $182,090 | $40,960 | $141,130 |
| 2016 | $12,903 | $174,810 | $39,320 | $135,490 |
| 2015 | $12,814 | $166,770 | $37,510 | $129,260 |
| 2014 | $13,550 | $173,110 | $61,290 | $111,820 |
| 2013 | $13,200 | $173,630 | $61,470 | $112,160 |
Source: Public Records
Map
Nearby Homes
- 1315 Underwood Terrace
- 840 Sheldon Ct Unit B
- 1026 Briarcliffe Blvd
- 1019 Pershing Ave
- 1216 E Elm St
- 715 S Naperville Rd
- 1129 Rhodes Ct
- 570 Riva Ct
- 510 S President St
- 1601 Castbourne Ct
- 1581 Groton Ln
- 1344 S Lorraine Rd Unit C
- 1000 S Lorraine Rd Unit 214
- 1678 Groton Ct
- 1180 Mount Vernon Ct Unit C
- 502 S Summit St
- 421 E Willow Ave
- 953 Cordova Ct
- 353 E Liberty Dr
- 522 S West St
- 718 Dawes Ave
- 705 Dawes Ave
- 1209 S Chase St
- 724 Dawes Ave
- 723 Dawes Ave
- 1205 S Chase St
- 615 Dawes Ave
- 1210 S Chase St
- 1203 S Chase St
- 730 Dawes Ave
- 1204 Fischer St
- 1206 S Chase St
- 1303 S Sumner St
- 1311 S Sumner St
- 1131 S Chase St
- 1202 S Chase St
- 1202 Fischer St
- 1315 S Sumner St
- 605 Dawes Ave
- 805 Dawes Ave
Your Personal Tour Guide
Ask me questions while you tour the home.