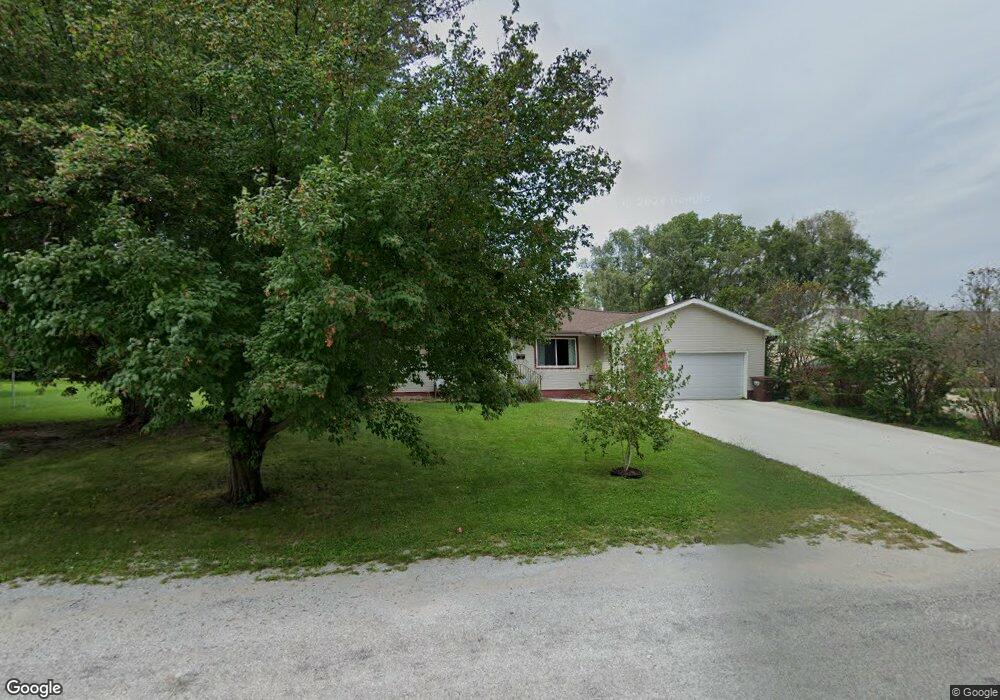
710 Maxwell St Maxwell, IA 50161
Estimated Value: $225,000 - $260,000
4
Beds
3
Baths
1,680
Sq Ft
$141/Sq Ft
Est. Value
About This Home
This home is located at 710 Maxwell St, Maxwell, IA 50161 and is currently estimated at $236,287, approximately $140 per square foot. 710 Maxwell St is a home located in Story County with nearby schools including Collins-Maxwell Elementary School and Collins-Maxwell Middle/High School.
Ownership History
Date
Name
Owned For
Owner Type
Purchase Details
Closed on
Apr 18, 2017
Sold by
Tillman Scott F and Tillman Tracy L
Bought by
Sharp Amanda S and Sharp Trevor E
Current Estimated Value
Home Financials for this Owner
Home Financials are based on the most recent Mortgage that was taken out on this home.
Original Mortgage
$119,200
Outstanding Balance
$98,837
Interest Rate
4.08%
Mortgage Type
New Conventional
Estimated Equity
$137,450
Create a Home Valuation Report for This Property
The Home Valuation Report is an in-depth analysis detailing your home's value as well as a comparison with similar homes in the area
Purchase History
| Date | Buyer | Sale Price | Title Company |
|---|---|---|---|
| Sharp Amanda S | -- | None Available |
Source: Public Records
Mortgage History
| Date | Status | Borrower | Loan Amount |
|---|---|---|---|
| Open | Sharp Amanda S | $119,200 |
Source: Public Records
Tax History
| Year | Tax Paid | Tax Assessment Tax Assessment Total Assessment is a certain percentage of the fair market value that is determined by local assessors to be the total taxable value of land and additions on the property. | Land | Improvement |
|---|---|---|---|---|
| 2025 | $3,366 | $217,500 | $37,500 | $180,000 |
| 2024 | $3,310 | $206,600 | $35,000 | $171,600 |
| 2023 | $3,340 | $206,600 | $35,000 | $171,600 |
| 2022 | $3,392 | $176,900 | $35,000 | $141,900 |
| 2021 | $3,316 | $176,900 | $35,000 | $141,900 |
| 2020 | $2,950 | $164,000 | $18,500 | $145,500 |
| 2019 | $2,950 | $164,000 | $18,500 | $145,500 |
| 2018 | $2,622 | $156,600 | $18,500 | $138,100 |
| 2017 | $2,622 | $156,600 | $18,500 | $138,100 |
| 2016 | $2,456 | $141,400 | $15,000 | $126,400 |
| 2015 | $2,456 | $141,400 | $15,000 | $126,400 |
| 2014 | $2,320 | $137,500 | $16,000 | $121,500 |
Source: Public Records
Map
Nearby Homes
Your Personal Tour Guide
Ask me questions while you tour the home.