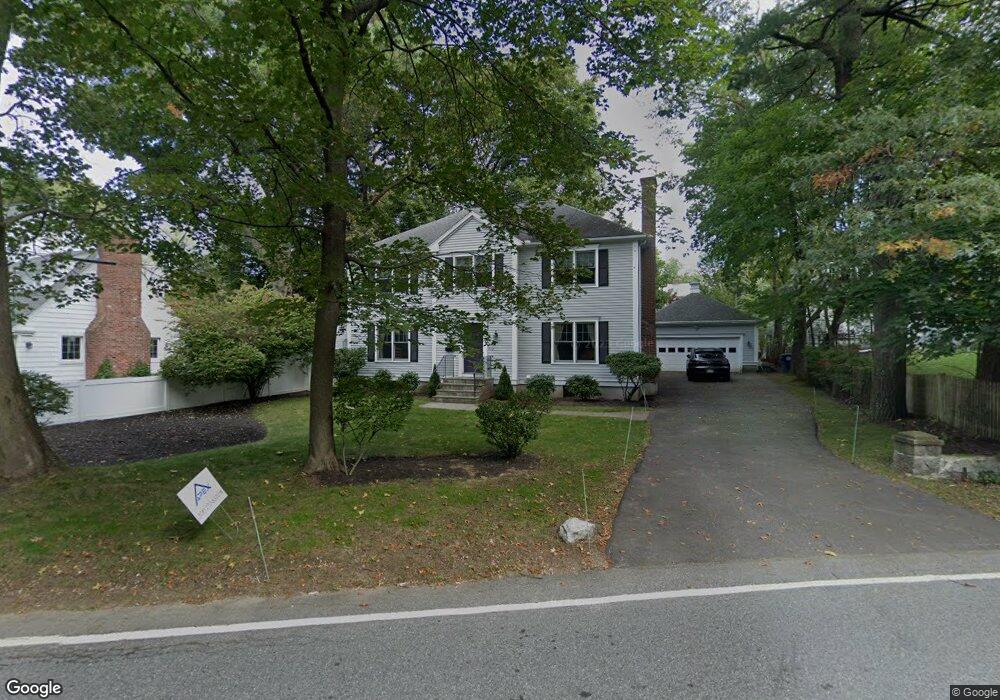
710 Quinobequin Rd Waban, MA 02468
Waban NeighborhoodEstimated Value: $1,786,000 - $1,927,000
4
Beds
4
Baths
2,394
Sq Ft
$770/Sq Ft
Est. Value
About This Home
This home is located at 710 Quinobequin Rd, Waban, MA 02468 and is currently estimated at $1,843,429, approximately $770 per square foot. 710 Quinobequin Rd is a home located in Middlesex County with nearby schools including Angier Elementary School, Charles E Brown Middle School, and Newton South High School.
Ownership History
Date
Name
Owned For
Owner Type
Purchase Details
Closed on
Apr 21, 2000
Sold by
Gifford Constr Corp
Bought by
Rose Mitchel D and Rose Karen K
Current Estimated Value
Home Financials for this Owner
Home Financials are based on the most recent Mortgage that was taken out on this home.
Original Mortgage
$498,700
Interest Rate
8.21%
Mortgage Type
Purchase Money Mortgage
Purchase Details
Closed on
Mar 23, 1999
Sold by
Disabato John L and Disabato Corrine M
Bought by
Gifford Constr Corp
Home Financials for this Owner
Home Financials are based on the most recent Mortgage that was taken out on this home.
Original Mortgage
$400,000
Interest Rate
6.74%
Mortgage Type
Purchase Money Mortgage
Create a Home Valuation Report for This Property
The Home Valuation Report is an in-depth analysis detailing your home's value as well as a comparison with similar homes in the area
Home Values in the Area
Average Home Value in this Area
Purchase History
| Date | Buyer | Sale Price | Title Company |
|---|---|---|---|
| Rose Mitchel D | $665,000 | -- | |
| Gifford Constr Corp | $625,000 | -- |
Source: Public Records
Mortgage History
| Date | Status | Borrower | Loan Amount |
|---|---|---|---|
| Open | Gifford Constr Corp | $414,800 | |
| Closed | Gifford Constr Corp | $300,000 | |
| Closed | Gifford Constr Corp | $498,700 | |
| Previous Owner | Gifford Constr Corp | $400,000 |
Source: Public Records
Tax History Compared to Growth
Tax History
| Year | Tax Paid | Tax Assessment Tax Assessment Total Assessment is a certain percentage of the fair market value that is determined by local assessors to be the total taxable value of land and additions on the property. | Land | Improvement |
|---|---|---|---|---|
| 2025 | $14,321 | $1,461,300 | $1,158,300 | $303,000 |
| 2024 | $13,847 | $1,418,700 | $1,124,600 | $294,100 |
| 2023 | $13,282 | $1,304,700 | $861,500 | $443,200 |
| 2022 | $12,709 | $1,208,100 | $797,700 | $410,400 |
| 2021 | $12,263 | $1,139,700 | $752,500 | $387,200 |
| 2020 | $11,320 | $1,084,300 | $752,500 | $331,800 |
| 2019 | $11,001 | $1,052,700 | $730,600 | $322,100 |
| 2018 | $10,689 | $987,900 | $663,000 | $324,900 |
| 2017 | $10,364 | $987,900 | $663,000 | $324,900 |
| 2016 | $9,912 | $871,000 | $584,600 | $286,400 |
| 2015 | $9,451 | $814,000 | $546,400 | $267,600 |
Source: Public Records
Map
Nearby Homes
- 873 Chestnut St
- 131 Oliver Rd
- 992 Chestnut St
- 1003 Chestnut St
- 120 Stanley Rd
- 66 Rockland Place
- 103 Thurston Rd
- 27 Hamilton Place
- 51 Pettee St Unit 11
- 102 Thurston Rd Unit 100
- 187 Saint Mary St
- 181 Saint Mary St
- 18 Annawan Rd
- 45 River Ave Unit 45
- 17 Circuit Ave Unit 2
- 1077 Boylston St
- 34 Pilgrim Rd
- 20 Pennsylvania Ave
- 20 Pennsylvania Ave Unit 20
- 18-20 Pennsylvania Ave Unit 18
- 700 Quinobequin Rd
- 893 Chestnut St
- 887 Chestnut St
- 877 Chestnut St
- 696 Quinobequin Rd
- 722 Quinobequin Rd
- 897 Chestnut St
- 892 Chestnut St
- 878 Chestnut St Unit 1
- 898 Chestnut St
- 907 Chestnut St
- 880 Chestnut St
- 880 Chestnut St Unit 3
- 880 Chestnut St Unit 1
- 886 Chestnut St Unit 888
- 902 Chestnut St
- 874 Chestnut St
- 863 Chestnut St
- 909 Chestnut St
- 908 Chestnut St Unit 2