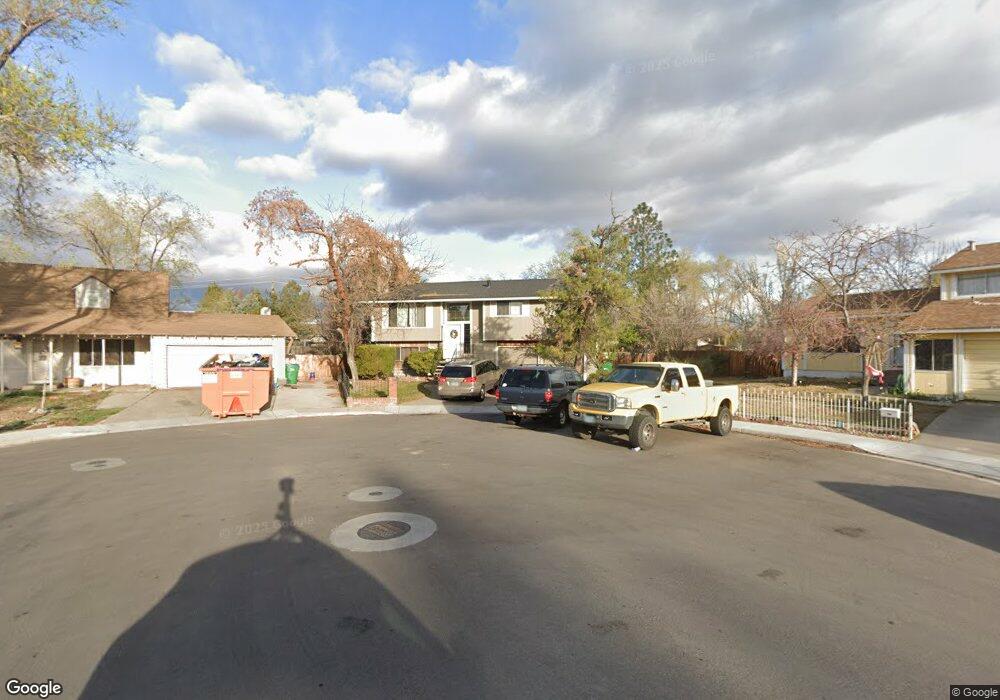
710 Sage View Ct Sparks, NV 89434
O'Callaghan NeighborhoodEstimated Value: $460,000 - $480,000
3
Beds
2
Baths
1,558
Sq Ft
$301/Sq Ft
Est. Value
About This Home
This home is located at 710 Sage View Ct, Sparks, NV 89434 and is currently estimated at $468,706, approximately $300 per square foot. 710 Sage View Ct is a home located in Washoe County with nearby schools including Katherine Dunn Elementary School, George L Dilworth Middle School, and Edward C Reed High School.
Ownership History
Date
Name
Owned For
Owner Type
Purchase Details
Closed on
Nov 18, 2010
Sold by
Delgado Jose Luis
Bought by
Delgado Jose L and Jose L Delgado Trust
Current Estimated Value
Home Financials for this Owner
Home Financials are based on the most recent Mortgage that was taken out on this home.
Original Mortgage
$95,000
Interest Rate
4.16%
Mortgage Type
New Conventional
Purchase Details
Closed on
Dec 27, 2007
Sold by
Delgado Jose L
Bought by
Delgado Jose L and The Jose L Delgado Trust
Purchase Details
Closed on
Feb 23, 2004
Sold by
Delgado Jose L
Bought by
Delgado Jose L
Home Financials for this Owner
Home Financials are based on the most recent Mortgage that was taken out on this home.
Original Mortgage
$136,500
Interest Rate
5.62%
Mortgage Type
New Conventional
Purchase Details
Closed on
Jun 12, 2000
Sold by
Delgado Jose L
Bought by
The Jose L Delgado Trust
Create a Home Valuation Report for This Property
The Home Valuation Report is an in-depth analysis detailing your home's value as well as a comparison with similar homes in the area
Home Values in the Area
Average Home Value in this Area
Purchase History
| Date | Buyer | Sale Price | Title Company |
|---|---|---|---|
| Delgado Jose L | -- | Western Title Company | |
| Delgado Jose Luis | -- | Western Title Company | |
| Delgado Jose L | -- | Accommodation | |
| Delgado Jose L | -- | Stewart Title Of Northern Nv | |
| The Jose L Delgado Trust | -- | -- |
Source: Public Records
Mortgage History
| Date | Status | Borrower | Loan Amount |
|---|---|---|---|
| Closed | Delgado Jose Luis | $95,000 | |
| Closed | Delgado Jose L | $136,500 |
Source: Public Records
Tax History Compared to Growth
Tax History
| Year | Tax Paid | Tax Assessment Tax Assessment Total Assessment is a certain percentage of the fair market value that is determined by local assessors to be the total taxable value of land and additions on the property. | Land | Improvement |
|---|---|---|---|---|
| 2025 | $1,846 | $60,967 | $35,411 | $25,556 |
| 2024 | $1,711 | $57,620 | $30,989 | $26,631 |
| 2023 | $1,182 | $56,071 | $30,125 | $25,946 |
| 2022 | $1,587 | $48,333 | $26,101 | $22,232 |
| 2021 | $1,470 | $42,827 | $20,116 | $22,711 |
| 2020 | $1,383 | $42,810 | $19,485 | $23,325 |
| 2019 | $1,316 | $40,746 | $17,922 | $22,824 |
| 2018 | $1,255 | $35,581 | $12,735 | $22,846 |
| 2017 | $1,205 | $35,499 | $12,170 | $23,329 |
| 2016 | $1,177 | $35,892 | $11,737 | $24,155 |
| 2015 | $1,175 | $34,065 | $9,210 | $24,855 |
| 2014 | $1,112 | $31,536 | $8,013 | $23,523 |
| 2013 | -- | $29,595 | $6,055 | $23,540 |
Source: Public Records
Map
Nearby Homes
- 949 Crestwood Dr Unit 3
- 848 Parkside Dr Unit 1
- 370 O'Brien Way
- 801 Woodglen Dr Unit 2
- 385 Gleeson Way
- 857 Cherry Tree Dr Unit 3
- 1973 Rio Tinto Dr
- 1897 Bonita Vista Dr
- 684 Oakwood Dr Unit 3
- 1218 Junction Dr
- 1544 Woodhaven Ln
- 8 E O St
- 1970 Woodhaven Ln
- 907 Camino Real Dr
- 644 Oakwood Dr Unit 2
- 745 Glen Vista Dr
- 913 Glen Molly Dr
- 611 Oakwood Dr Unit 1
- 360 E Lincoln Way
- 601 Oakwood Dr Unit 4
- 730 Sage View Ct
- 705 Sage View Ct
- 731 Desert View Ct
- 760 Sage View Ct
- 711 Desert View Ct
- 735 Sage View Ct
- 735 Sage View Ct
- 761 Desert View Ct Unit 7
- 755 Sage View Ct
- 1325 Howard Dr
- 1355 Howard Dr
- 775 Sage View Ct
- 1400 Driftwood Ct
- 712 Desert View Ct
- 1460 Driftwood Ct
- 791 Desert View Ct
- 785 Sage View Ct
- 732 Desert View Ct
- 1300 N Mccarran Blvd
- 1490 Driftwood Ct