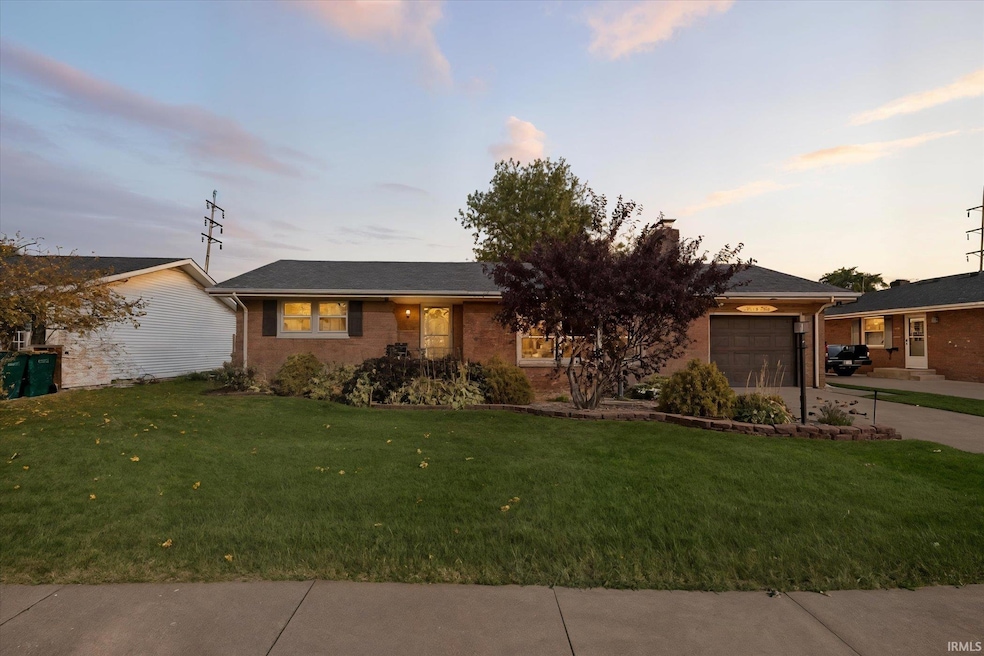
710 W 13th St Mishawaka, IN 46544
Estimated payment $1,269/month
Highlights
- 1 Car Attached Garage
- 1-Story Property
- Property is Fully Fenced
- Fireplace in Basement
- Central Air
About This Home
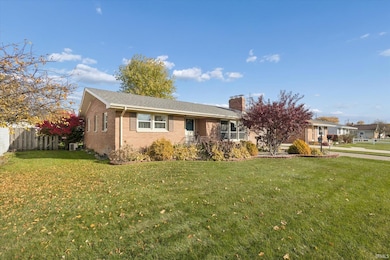
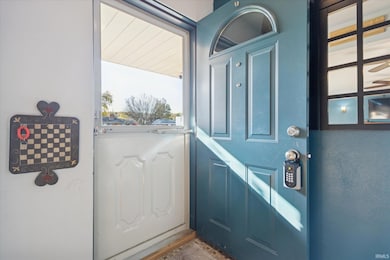
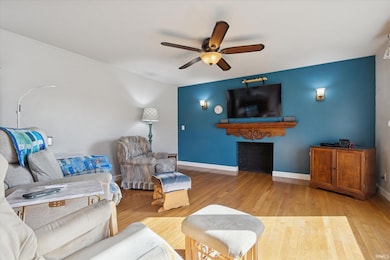
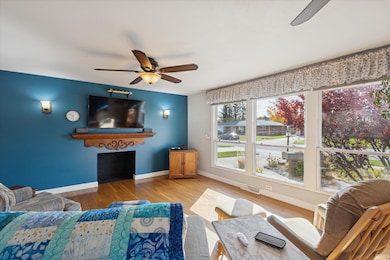
Don't miss out on this fantastic opportunity! This beautifully well-maintained brick home is perfectly situated in a prime Mishawaka location. Offering a comfortable 2 bedrooms, 1.5 bathroom layout with a finished basement perfect for entertaining. Experience peace of mind with a brand-new roof installed this year, main floor laundry, and an irrigation system! This home is truly turn-key and waiting for you!
Listing Agent
Brick Built Real Estate Brokerage Phone: 574-261-6309 Listed on: 11/06/2025
Home Details
Home Type
- Single Family
Est. Annual Taxes
- $1,960
Year Built
- Built in 1962
Lot Details
- 8,514 Sq Ft Lot
- Lot Dimensions are 66x29
- Property is Fully Fenced
- Chain Link Fence
- Irregular Lot
- Irrigation
Parking
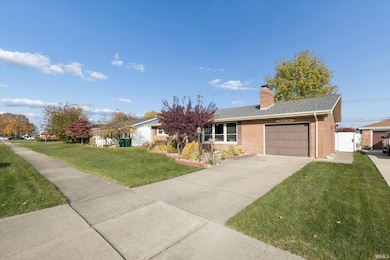
- 1 Car Attached Garage
- Off-Street Parking
Home Design
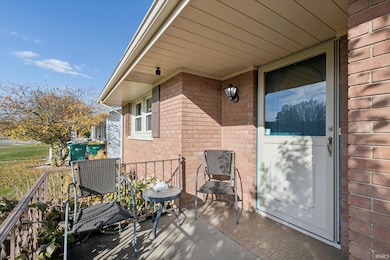
- Brick Exterior Construction
- Asphalt Roof
Interior Spaces
- 1-Story Property
- Living Room with Fireplace
- Laundry on main level
Bedrooms and Bathrooms
- 2 Bedrooms
Basement
- Basement Fills Entire Space Under The House
- Fireplace in Basement
- Block Basement Construction
- 1 Bathroom in Basement
Schools
- Emmons Elementary School
- John Young Middle School
- Mishawaka High School
Utilities
- Central Air
- Heating System Uses Gas
- Private Company Owned Well
Listing and Financial Details
- Assessor Parcel Number 71-09-21-127-003.000-023
Map
Home Values in the Area
Average Home Value in this Area
Tax History
| Year | Tax Paid | Tax Assessment Tax Assessment Total Assessment is a certain percentage of the fair market value that is determined by local assessors to be the total taxable value of land and additions on the property. | Land | Improvement |
|---|---|---|---|---|
| 2024 | $1,981 | $167,900 | $35,900 | $132,000 |
| 2023 | $1,989 | $168,500 | $35,900 | $132,600 |
| 2022 | $1,989 | $173,000 | $35,900 | $137,100 |
| 2021 | $1,690 | $147,900 | $22,300 | $125,600 |
| 2020 | $1,309 | $116,600 | $20,100 | $96,500 |
| 2019 | $1,176 | $105,500 | $18,200 | $87,300 |
| 2018 | $990 | $88,500 | $16,100 | $72,400 |
| 2017 | $991 | $86,400 | $16,100 | $70,300 |
| 2016 | $756 | $79,100 | $14,100 | $65,000 |
| 2014 | $669 | $78,000 | $14,100 | $63,900 |
Property History
| Date | Event | Price | List to Sale | Price per Sq Ft |
|---|---|---|---|---|
| 11/07/2025 11/07/25 | Pending | -- | -- | -- |
| 11/06/2025 11/06/25 | For Sale | $210,000 | -- | $88 / Sq Ft |
Purchase History
| Date | Type | Sale Price | Title Company |
|---|---|---|---|
| Warranty Deed | -- | None Available | |
| Trustee Deed | -- | Metropolitan Title In Llc |
Mortgage History
| Date | Status | Loan Amount | Loan Type |
|---|---|---|---|
| Previous Owner | $105,000 | New Conventional |
Source: Indiana Regional MLS
MLS Number: 202544951
APN: 71-09-21-127-003.000-023
Disclaimer: Certain information contained herein is derived from information provided by parties other than Homes.com. All information provided is deemed reliable, but is not guaranteed to be accurate and should be independently verified.
![]() IDX information is provided exclusively for personal, non-commercial use, and may not be used for any purpose other than to identify prospective properties consumers may be interested in purchasing. Information is deemed reliable but not guaranteed.
IDX information is provided exclusively for personal, non-commercial use, and may not be used for any purpose other than to identify prospective properties consumers may be interested in purchasing. Information is deemed reliable but not guaranteed.
- 804 W 15th St
- 1411 Berkley Cir
- 801 S Spring St
- 1318 S Spring St
- 403 W 7th St
- 821 S Logan St
- 530 W 5th St
- 330 W 6th St
- 1014 S Main St
- 902 S Main St Unit A & B
- 314 Harrison St
- 542 W 4th St
- 1025 Lincolnway W
- 131 E 6th St
- 314 E 16th St
- 1213 Lincolnway W
- 209 E 6th St
- 1002 Alabama St
- 510 Reddick St
- 728 Dale Ave
