
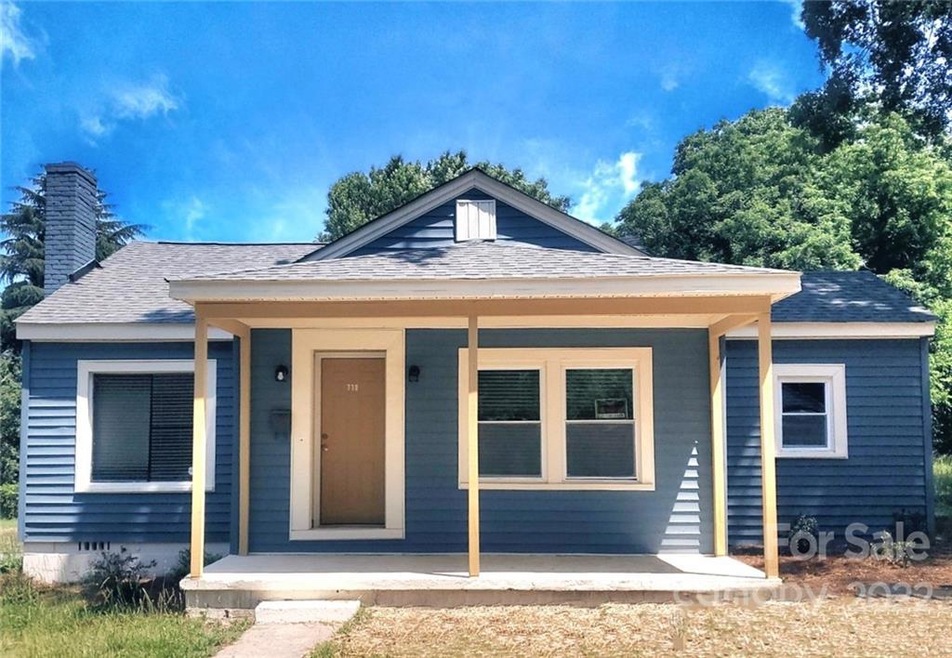
710 W Elm St Shelby, NC 28150
2
Beds
1
Bath
1,127
Sq Ft
0.26
Acres
Highlights
- No HOA
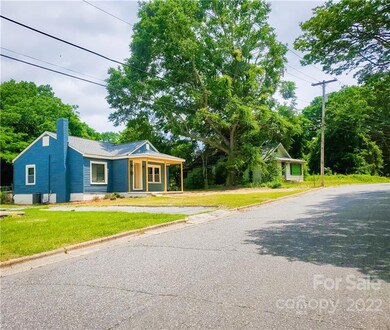
- Bungalow
- Baseboard Heating
- Laundry Room
- 1-Story Property
About This Home
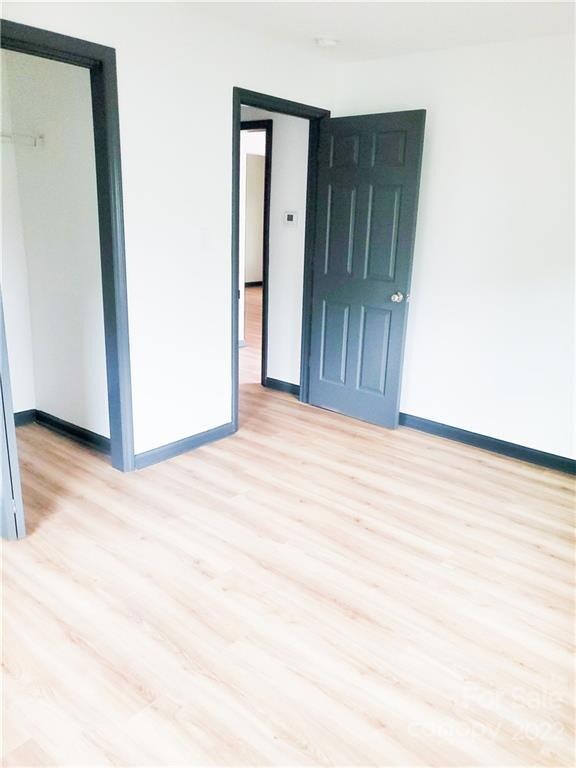
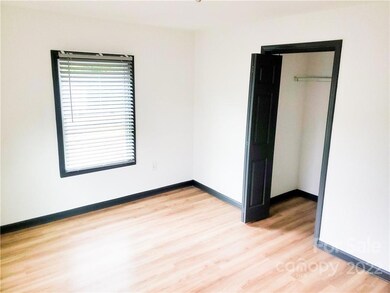
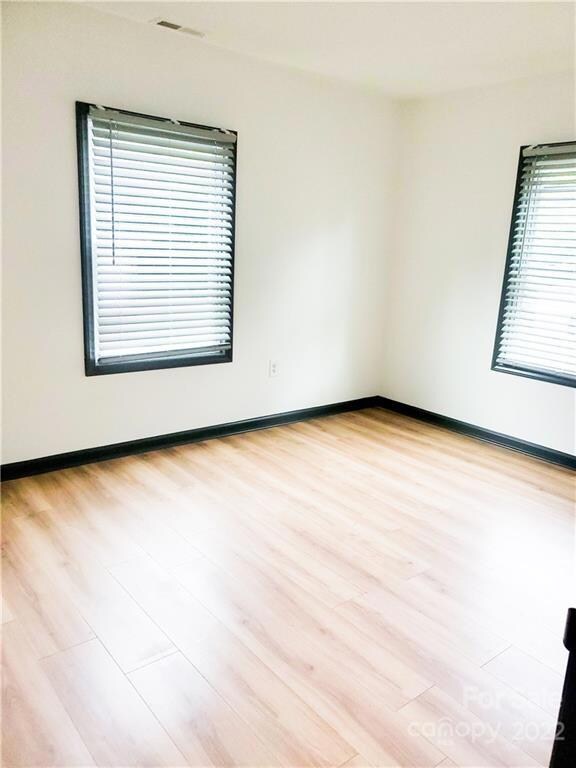
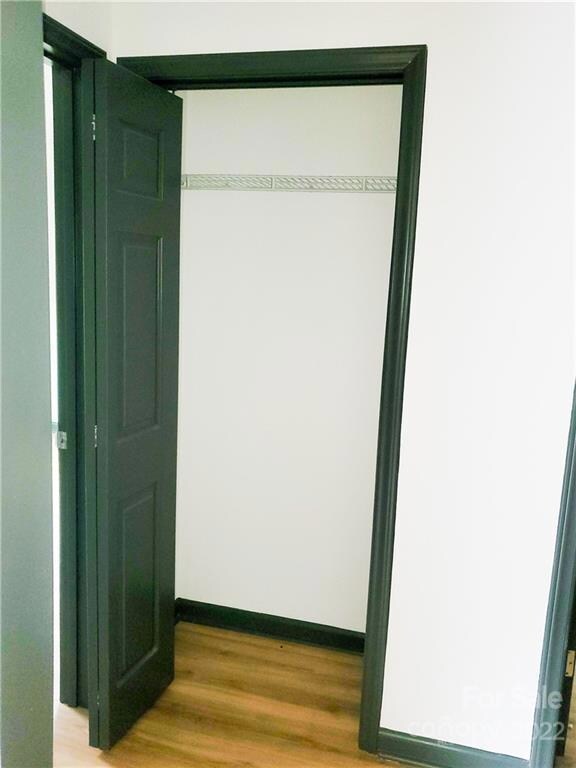
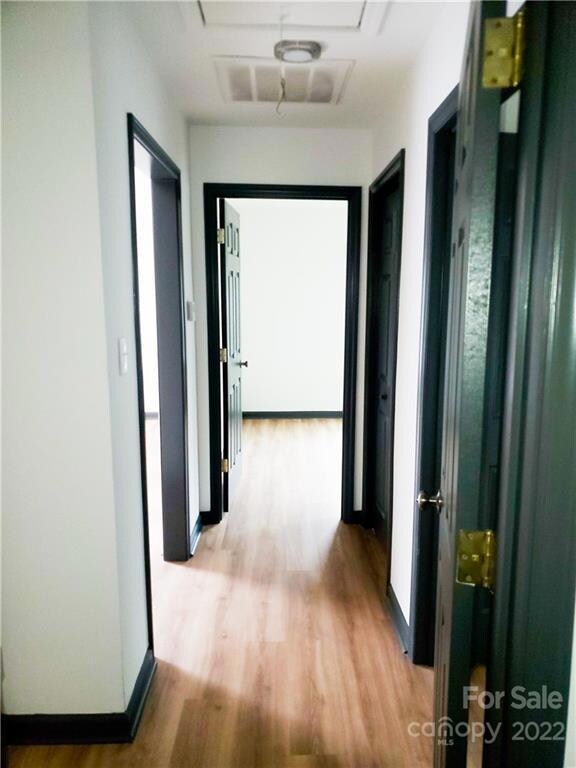
As of November 2022This is your chance to downsize and/or simplify your life in a comfortable, move-in-ready bungalow. This newly renovated 2 bedroom 1 bath home is just what you need. The backyard is spacious and perfect for gatherings with family and friends, in an up-and-coming neighborhood that's close to all the amenities you could want. You'll be able to take advantage of the easy access to the highway if you need to head out of town on short notice, and the mountains are just a short drive away. New appliances give this home a modern edge, while wide streets make it easy for visitors to find parking. The bonus room makes this a great home with additional space for an entrepreneur's office, craft room, or whatever you need. Will not last long...Don't miss this opportunity. More photos coming soon.
Last Agent to Sell the Property
Young & Company Real Estate Brokerage Email: kiameshayoungteam@ycre.us License #238860 Listed on: 05/26/2022
Home Details
Home Type
- Single Family
Est. Annual Taxes
- $732
Year Built
- Built in 1946
Lot Details
- 0.26 Acre Lot
- Property is zoned R8
Home Design
- Bungalow
- Vinyl Siding
Interior Spaces
- 1,127 Sq Ft Home
- 1-Story Property
- Laminate Flooring
- Crawl Space
- Laundry Room
Kitchen
- Oven
- Electric Cooktop
Bedrooms and Bathrooms
- 2 Main Level Bedrooms
- 1 Full Bathroom
Parking
- On-Street Parking
- 2 Open Parking Spaces
Utilities
- Window Unit Cooling System
- Baseboard Heating
- Gas Water Heater
Community Details
- No Home Owners Association
Listing and Financial Details
- Assessor Parcel Number 72554
Ownership History
Date
Name
Owned For
Owner Type
Purchase Details
Listed on
May 26, 2022
Closed on
Nov 3, 2022
Sold by
843 Sisters With A Purpose Llc
Bought by
Tabet Bassel
Seller's Agent
Kiamesha Young
Young & Company Real Estate
Buyer's Agent
Shevela Parris
Coldwell Banker Mountain View
List Price
$160,000
Sold Price
$145,000
Premium/Discount to List
-$15,000
-9.38%
Views
30
Home Financials for this Owner
Home Financials are based on the most recent Mortgage that was taken out on this home.
Avg. Annual Appreciation
8.29%
Original Mortgage
$142,373
Interest Rate
7.08%
Mortgage Type
FHA
Purchase Details
Listed on
Sep 23, 2021
Closed on
Oct 30, 2021
Sold by
Hubbard Property Llc
Bought by
843 Sisters With A Purpose Llc
Seller's Agent
Nancy Braun
Showcase Realty LLC
Buyer's Agent
Ashley Jennings
Jennings Real Estate Group, LLC
List Price
$80,000
Sold Price
$60,000
Premium/Discount to List
-$20,000
-25%
Home Financials for this Owner
Home Financials are based on the most recent Mortgage that was taken out on this home.
Avg. Annual Appreciation
128.11%
Original Mortgage
$125,000
Interest Rate
2.88%
Mortgage Type
Future Advance Clause Open End Mortgage
Purchase Details
Closed on
May 24, 2019
Sold by
Patterson Tori Romell
Bought by
Hubbard Property Llc
Purchase Details
Closed on
Mar 8, 2012
Sold by
Trp Investments Llc
Bought by
Patterson Tori Romell
Similar Homes in Shelby, NC
Create a Home Valuation Report for This Property
The Home Valuation Report is an in-depth analysis detailing your home's value as well as a comparison with similar homes in the area
Home Values in the Area
Average Home Value in this Area
Purchase History
| Date | Type | Sale Price | Title Company |
|---|---|---|---|
| Warranty Deed | $45,000 | -- | |
| Warranty Deed | $60,000 | None Available | |
| Warranty Deed | $33,000 | None Available | |
| Interfamily Deed Transfer | -- | None Available |
Source: Public Records
Mortgage History
| Date | Status | Loan Amount | Loan Type |
|---|---|---|---|
| Open | $144,210 | FHA | |
| Closed | $142,373 | FHA | |
| Previous Owner | $125,000 | Future Advance Clause Open End Mortgage |
Source: Public Records
Property History
| Date | Event | Price | Change | Sq Ft Price |
|---|---|---|---|---|
| 05/30/2025 05/30/25 | Price Changed | $183,500 | -0.8% | $163 / Sq Ft |
| 11/14/2024 11/14/24 | For Sale | $184,900 | +27.5% | $164 / Sq Ft |
| 11/28/2022 11/28/22 | Sold | $145,000 | 0.0% | $129 / Sq Ft |
| 10/12/2022 10/12/22 | Off Market | $145,000 | -- | -- |
| 10/05/2022 10/05/22 | Price Changed | $145,000 | -0.7% | $129 / Sq Ft |
| 10/04/2022 10/04/22 | Price Changed | $146,000 | -0.7% | $130 / Sq Ft |
| 10/03/2022 10/03/22 | Price Changed | $147,000 | -0.7% | $130 / Sq Ft |
| 09/30/2022 09/30/22 | Price Changed | $148,000 | -0.7% | $131 / Sq Ft |
| 09/29/2022 09/29/22 | Price Changed | $149,000 | -0.7% | $132 / Sq Ft |
| 09/28/2022 09/28/22 | Price Changed | $150,000 | -1.3% | $133 / Sq Ft |
| 09/27/2022 09/27/22 | Price Changed | $152,000 | +0.7% | $135 / Sq Ft |
| 09/27/2022 09/27/22 | Price Changed | $151,000 | -0.7% | $134 / Sq Ft |
| 09/26/2022 09/26/22 | Price Changed | $152,000 | -0.7% | $135 / Sq Ft |
| 09/23/2022 09/23/22 | Price Changed | $153,000 | -0.6% | $136 / Sq Ft |
| 09/22/2022 09/22/22 | Price Changed | $154,000 | -0.6% | $137 / Sq Ft |
| 09/21/2022 09/21/22 | Price Changed | $155,000 | -0.6% | $138 / Sq Ft |
| 09/20/2022 09/20/22 | Price Changed | $156,000 | -0.6% | $138 / Sq Ft |
| 09/20/2022 09/20/22 | Price Changed | $157,000 | -0.6% | $139 / Sq Ft |
| 09/19/2022 09/19/22 | Price Changed | $158,000 | +0.6% | $140 / Sq Ft |
| 09/19/2022 09/19/22 | Price Changed | $157,000 | -0.6% | $139 / Sq Ft |
| 09/16/2022 09/16/22 | Price Changed | $158,000 | -0.6% | $140 / Sq Ft |
| 09/15/2022 09/15/22 | Price Changed | $159,000 | -0.6% | $141 / Sq Ft |
| 09/14/2022 09/14/22 | Price Changed | $160,000 | 0.0% | $142 / Sq Ft |
| 09/14/2022 09/14/22 | For Sale | $160,000 | +10.3% | $142 / Sq Ft |
| 08/18/2022 08/18/22 | Off Market | $145,000 | -- | -- |
| 08/01/2022 08/01/22 | Price Changed | $156,000 | -0.6% | $138 / Sq Ft |
| 07/29/2022 07/29/22 | Price Changed | $157,000 | -0.6% | $139 / Sq Ft |
| 07/28/2022 07/28/22 | Price Changed | $158,000 | -0.6% | $140 / Sq Ft |
| 07/27/2022 07/27/22 | Price Changed | $159,000 | -0.6% | $141 / Sq Ft |
| 07/26/2022 07/26/22 | Price Changed | $160,000 | -0.6% | $142 / Sq Ft |
| 07/25/2022 07/25/22 | Price Changed | $161,000 | -0.6% | $143 / Sq Ft |
| 07/23/2022 07/23/22 | Price Changed | $162,000 | -0.6% | $144 / Sq Ft |
| 07/22/2022 07/22/22 | Price Changed | $163,000 | +0.6% | $145 / Sq Ft |
| 07/22/2022 07/22/22 | Price Changed | $162,000 | -0.6% | $144 / Sq Ft |
| 07/21/2022 07/21/22 | Price Changed | $163,000 | -0.6% | $145 / Sq Ft |
| 07/20/2022 07/20/22 | Price Changed | $164,000 | -0.6% | $146 / Sq Ft |
| 07/05/2022 07/05/22 | Price Changed | $165,000 | -37.7% | $146 / Sq Ft |
| 07/05/2022 07/05/22 | Price Changed | $265,000 | +51.4% | $235 / Sq Ft |
| 06/22/2022 06/22/22 | Price Changed | $175,000 | -10.3% | $155 / Sq Ft |
| 06/09/2022 06/09/22 | Price Changed | $195,000 | -2.5% | $173 / Sq Ft |
| 05/26/2022 05/26/22 | For Sale | $200,000 | +233.3% | $177 / Sq Ft |
| 11/03/2021 11/03/21 | Sold | $60,000 | -25.0% | $63 / Sq Ft |
| 10/06/2021 10/06/21 | Pending | -- | -- | -- |
| 09/23/2021 09/23/21 | For Sale | $80,000 | -- | $84 / Sq Ft |
Source: Canopy MLS (Canopy Realtor® Association)
Tax History Compared to Growth
Tax History
| Year | Tax Paid | Tax Assessment Tax Assessment Total Assessment is a certain percentage of the fair market value that is determined by local assessors to be the total taxable value of land and additions on the property. | Land | Improvement |
|---|---|---|---|---|
| 2024 | $732 | $58,661 | $3,650 | $55,011 |
| 2023 | $234 | $58,661 | $3,650 | $55,011 |
| 2022 | $233 | $17,368 | $3,650 | $13,718 |
| 2021 | $234 | $17,368 | $3,650 | $13,718 |
| 2020 | $114 | $9,188 | $3,650 | $5,538 |
| 2019 | $114 | $9,188 | $3,650 | $5,538 |
| 2018 | $114 | $9,188 | $3,650 | $5,538 |
| 2017 | $111 | $9,188 | $3,650 | $5,538 |
| 2016 | $112 | $9,188 | $3,650 | $5,538 |
| 2015 | $374 | $30,785 | $3,650 | $27,135 |
| 2014 | $374 | $30,785 | $3,650 | $27,135 |
Source: Public Records
Agents Affiliated with this Home
-
Tracy Whisnant
Seller's Agent in 2024
Tracy Whisnant
RE/MAX
(704) 477-7391
310 in this area
576 Total Sales
-
Kiamesha Young
Seller's Agent in 2022
Kiamesha Young
Young & Company Real Estate
(704) 919-7632
6 in this area
29 Total Sales
-
Shevela Parris
S
Buyer's Agent in 2022
Shevela Parris
Coldwell Banker Mountain View
(704) 799-3700
8 in this area
13 Total Sales
-
Nancy Braun
Seller's Agent in 2021
Nancy Braun
Showcase Realty LLC
(704) 997-3794
13 in this area
576 Total Sales
-
Ashley Jennings
A
Buyer's Agent in 2021
Ashley Jennings
Jennings Real Estate Group, LLC
(704) 840-8612
32 in this area
54 Total Sales
Map
Source: Canopy MLS (Canopy Realtor® Association)
MLS Number: 3862435
APN: 72554
Disclaimer: Certain information contained herein is derived from information provided by parties other than Homes.com. All information provided is deemed reliable, but is not guaranteed to be accurate and should be independently verified.
![]() Based on information submitted to the MLS GRID. All data is obtained from various sources and may not have been verified by broker or MLS GRID. Supplied Open House Information is subject to change without notice. All information should be independently reviewed and verified for accuracy. Properties may or may not be listed by the office/agent presenting the information. Some IDX listings have been excluded from this website.
Based on information submitted to the MLS GRID. All data is obtained from various sources and may not have been verified by broker or MLS GRID. Supplied Open House Information is subject to change without notice. All information should be independently reviewed and verified for accuracy. Properties may or may not be listed by the office/agent presenting the information. Some IDX listings have been excluded from this website.
The Digital Millennium Copyright Act of 1998, 17 U.S.C. § 512 (the “DMCA”) provides recourse for copyright owners who believe that material appearing on the Internet infringes their rights under U.S. copyright law. If you believe in good faith that any content or material made available in connection with our website or services infringes your copyright, you (or your agent) may send us a notice requesting that the content or material be removed, or access to it blocked.
Notices must be sent in writing by email to DMCAnotice@MLSGrid.com.
The DMCA requires that your notice of alleged copyright infringement include the following information:
(1) description of the copyrighted work that is the subject of claimed infringement;
(2) description of the alleged infringing content and information sufficient to permit us to locate the content;
(3) contact information for you, including your address, telephone number and email address;
(4) a statement by you that you have a good faith belief that the content in the manner complained of is not authorized by the copyright owner, or its agent, or by the operation of any law;
(5) a statement by you, signed under penalty of perjury, that the information in the notification is accurate and that you have the authority to enforce the copyrights that are claimed to be infringed; and
(6) a physical or electronic signature of the copyright owner or a person authorized to act on the copyright owner’s behalf. Failure to include all of the above information may result in the delay of the processing of your complaint.
Nearby Homes