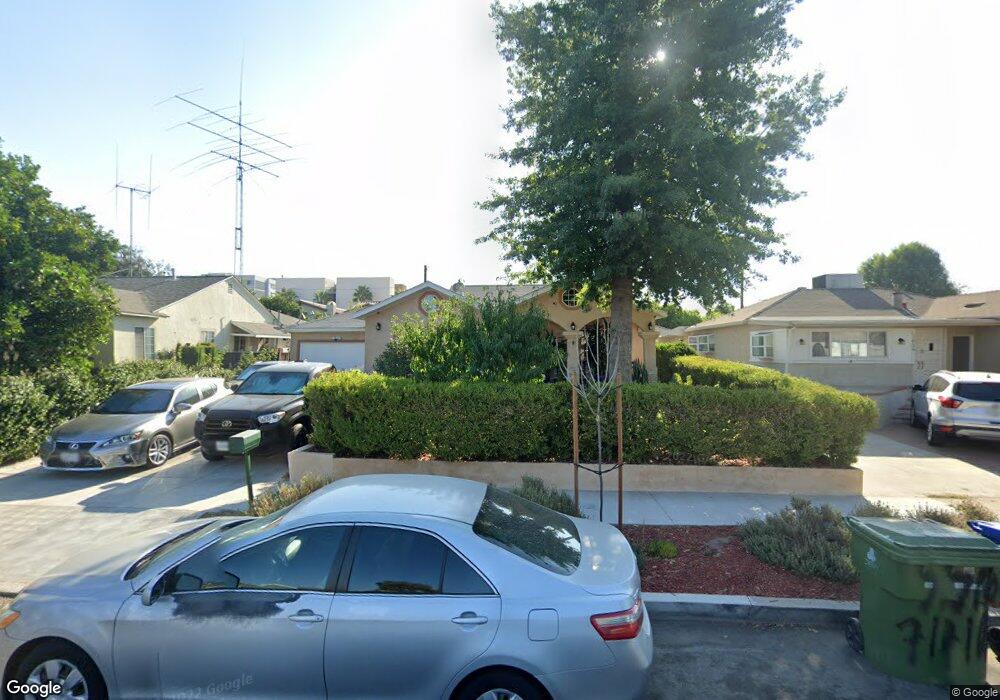
7100 Natick Ave van Nuys, CA 91405
Estimated Value: $848,697 - $1,029,000
4
Beds
3
Baths
1,994
Sq Ft
$462/Sq Ft
Est. Value
About This Home
This home is located at 7100 Natick Ave, van Nuys, CA 91405 and is currently estimated at $921,924, approximately $462 per square foot. 7100 Natick Ave is a home located in Los Angeles County with nearby schools including Valerio Street Elementary School, Robert Fulton College Preparatory, and Van Nuys High School.
Ownership History
Date
Name
Owned For
Owner Type
Purchase Details
Closed on
Mar 19, 2003
Sold by
Castro Jose and Castro Rosalina
Bought by
Castro Jose
Current Estimated Value
Home Financials for this Owner
Home Financials are based on the most recent Mortgage that was taken out on this home.
Original Mortgage
$190,000
Outstanding Balance
$81,144
Interest Rate
5.79%
Estimated Equity
$840,780
Purchase Details
Closed on
Feb 12, 1997
Sold by
Juarez Jose A and Castro Jose
Bought by
Castro Jose
Purchase Details
Closed on
May 30, 1996
Sold by
Va
Bought by
Juarez Jose A
Home Financials for this Owner
Home Financials are based on the most recent Mortgage that was taken out on this home.
Original Mortgage
$124,294
Interest Rate
7.96%
Mortgage Type
Seller Take Back
Purchase Details
Closed on
Apr 18, 1995
Sold by
Citicorp Mtg Inc
Bought by
Va
Purchase Details
Closed on
Apr 17, 1995
Sold by
Aldridge Adelbert F and Aldridge Marcela L
Bought by
Citicorp Mtg Inc
Create a Home Valuation Report for This Property
The Home Valuation Report is an in-depth analysis detailing your home's value as well as a comparison with similar homes in the area
Home Values in the Area
Average Home Value in this Area
Purchase History
| Date | Buyer | Sale Price | Title Company |
|---|---|---|---|
| Castro Jose | -- | Fidelity National Title Co | |
| Castro Jose | -- | -- | |
| Juarez Jose A | $126,000 | American Title Ins Co | |
| Va | -- | First Southwestern Title | |
| Citicorp Mtg Inc | $119,907 | First Southwestern Title |
Source: Public Records
Mortgage History
| Date | Status | Borrower | Loan Amount |
|---|---|---|---|
| Open | Castro Jose | $190,000 | |
| Previous Owner | Juarez Jose A | $124,294 |
Source: Public Records
Tax History
| Year | Tax Paid | Tax Assessment Tax Assessment Total Assessment is a certain percentage of the fair market value that is determined by local assessors to be the total taxable value of land and additions on the property. | Land | Improvement |
|---|---|---|---|---|
| 2025 | $3,601 | $287,398 | $98,686 | $188,712 |
| 2024 | $3,601 | $281,763 | $96,751 | $185,012 |
| 2023 | $3,534 | $276,239 | $94,854 | $181,385 |
| 2022 | $3,373 | $270,824 | $92,995 | $177,829 |
| 2021 | $3,321 | $265,515 | $91,172 | $174,343 |
| 2019 | $3,223 | $257,642 | $88,469 | $169,173 |
| 2018 | $3,144 | $252,591 | $86,735 | $165,856 |
| 2016 | $2,983 | $242,784 | $83,368 | $159,416 |
| 2015 | $2,940 | $239,138 | $82,116 | $157,022 |
| 2014 | $2,956 | $234,455 | $80,508 | $153,947 |
Source: Public Records
Map
Nearby Homes
- 14665 Sherman Way
- 14734 Marlin Place
- 14821 Sherman Way Unit 12
- 6912 Cedros Ave
- 14541 Hart St
- 7061 Kester Ave Unit C
- 14929 Vose St
- 14719 Wyandotte St
- 14931 Vose St
- 6842 Cedros Ave
- 7117 Kester Ave
- 6840 Kester Ave
- 14840 Hartland St
- 14703 Archwood St
- 15051 Sherman Way
- 15050 Sherman Way Unit 166
- 15050 Sherman Way Unit 190
- 14841 Archwood St
- 14552 Runnymede St
- 15033 Hartland St
- 7106 Natick Ave
- 7052 Natick Ave
- 7110 Natick Ave
- 7103 N Marisa Rd
- 7105 N Marisa Rd
- 7107 N Marisa Rd
- 7057 Cedros Ave
- 7046 Natick Ave
- 7109 N Marisa Rd
- 7116 Natick Ave
- 7053 Cedros Ave
- 7111 N Marisa Rd
- 7105 Natick Ave
- 7104 N Marisa Rd
- 7101 Natick Ave
- 7113 N Marisa Rd
- 7057 Natick Ave
- 7107 Natick Ave
- 7106 N Marisa Rd
- 7042 Natick Ave
Your Personal Tour Guide
Ask me questions while you tour the home.