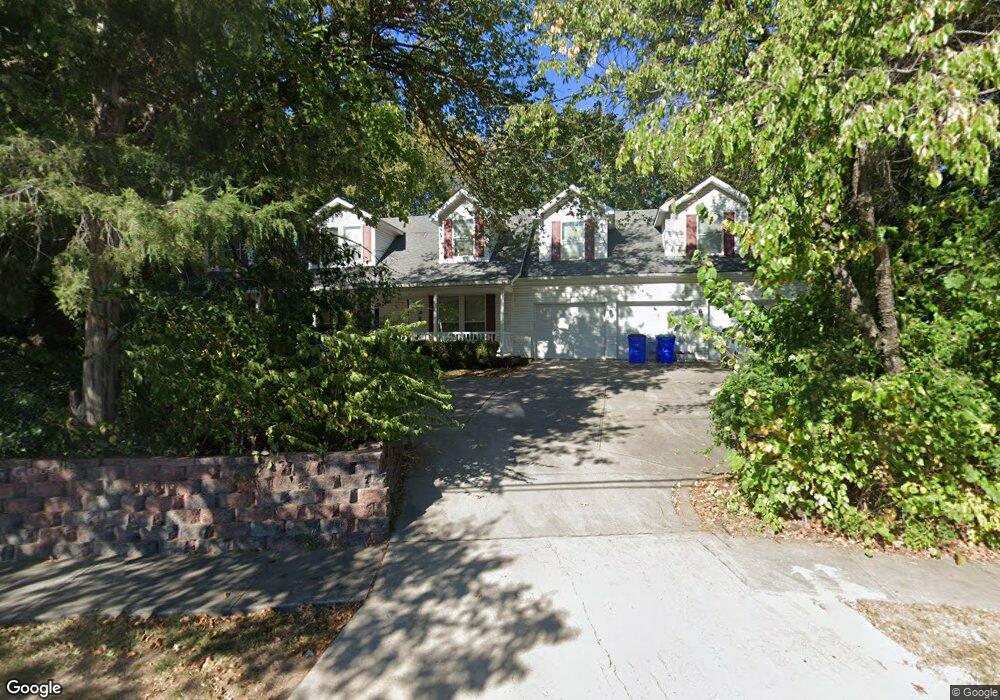
7100 W 83rd St Overland Park, KS 66204
Downtown Overland Park NeighborhoodEstimated Value: $444,000 - $531,000
3
Beds
3
Baths
2,824
Sq Ft
$170/Sq Ft
Est. Value
About This Home
This home is located at 7100 W 83rd St, Overland Park, KS 66204 and is currently estimated at $480,872, approximately $170 per square foot. 7100 W 83rd St is a home located in Johnson County with nearby schools including Overland Park Elementary School, Westridge Middle School, and Shawnee Mission West High School.
Ownership History
Date
Name
Owned For
Owner Type
Purchase Details
Closed on
May 6, 2022
Sold by
Ruttan Phillip C
Bought by
Phillip C Ruttan Trust
Current Estimated Value
Purchase Details
Closed on
Aug 20, 2020
Sold by
Ruttan Phillip C and Phillip C Ruttan Trust
Bought by
Ruttan Phillip C
Home Financials for this Owner
Home Financials are based on the most recent Mortgage that was taken out on this home.
Original Mortgage
$265,470
Interest Rate
3%
Mortgage Type
VA
Purchase Details
Closed on
Oct 5, 2018
Sold by
Ruttan Phillip C and The Phillip C Ruyfan And Jeril
Bought by
Ruttan Phillip C and The Phillip C Ruttan Trust
Purchase Details
Closed on
Jan 30, 2017
Sold by
Ruttan Phillip C and Ruttan Jerilyn J
Bought by
Ruttan Phillip C and Ruttan Jerilyn J
Purchase Details
Closed on
Feb 13, 2004
Sold by
L & P Enterprises
Bought by
Ruttan Philip C and Ruttan Jerilyn J
Home Financials for this Owner
Home Financials are based on the most recent Mortgage that was taken out on this home.
Original Mortgage
$255,000
Interest Rate
6.35%
Mortgage Type
Purchase Money Mortgage
Create a Home Valuation Report for This Property
The Home Valuation Report is an in-depth analysis detailing your home's value as well as a comparison with similar homes in the area
Home Values in the Area
Average Home Value in this Area
Purchase History
| Date | Buyer | Sale Price | Title Company |
|---|---|---|---|
| Phillip C Ruttan Trust | -- | Evans & Mullinix Pa | |
| Ruttan Phillip C | -- | Servicelink | |
| Ruttan Phillip C | -- | None Available | |
| Ruttan Phillip C | -- | None Available | |
| Ruttan Philip C | -- | -- |
Source: Public Records
Mortgage History
| Date | Status | Borrower | Loan Amount |
|---|---|---|---|
| Previous Owner | Ruttan Phillip C | $265,470 | |
| Previous Owner | Ruttan Philip C | $255,000 |
Source: Public Records
Tax History Compared to Growth
Tax History
| Year | Tax Paid | Tax Assessment Tax Assessment Total Assessment is a certain percentage of the fair market value that is determined by local assessors to be the total taxable value of land and additions on the property. | Land | Improvement |
|---|---|---|---|---|
| 2024 | $5,157 | $53,084 | $7,636 | $45,448 |
| 2023 | $4,723 | $48,128 | $7,636 | $40,492 |
| 2022 | $4,268 | $43,815 | $7,636 | $36,179 |
| 2021 | $4,247 | $41,561 | $6,105 | $35,456 |
| 2020 | $4,036 | $39,537 | $4,884 | $34,653 |
| 2019 | $3,674 | $36,030 | $3,250 | $32,780 |
| 2018 | $3,485 | $34,040 | $3,250 | $30,790 |
| 2017 | $3,229 | $31,027 | $3,250 | $27,777 |
| 2016 | $3,162 | $29,889 | $3,250 | $26,639 |
| 2015 | $2,893 | $27,899 | $3,250 | $24,649 |
| 2013 | -- | $26,013 | $3,250 | $22,763 |
Source: Public Records
Map
Nearby Homes
- 8231 Travis St
- 8221 Travis St
- 6909 W 82nd St
- 8330 Riley St
- 6901 W 82nd St
- 6825 W 82nd St
- 8340 Riggs St
- 6725 W 85th Terrace
- 6421 W 81st Terrace
- 6404 W 82nd St
- 8100 Lowell Ave
- 6904 W 79th St
- 8020 Lowell Ave
- 8204 Tomahawk Rd
- 8101 Goodman St
- 8304 Hemlock St
- 8331 Beverly Dr
- 6116 W 85th Terrace
- 8100 Beverly Dr
- 7909 Lamar Ave
- 7200 W 83rd St
- 8242 Overland Park Dr
- 8301 Floyd St
- 8238 Overland Park Dr
- 8234 Overland Park Dr
- 8300 Floyd St
- 8310 Metcalf Ave
- 8308 Metcalf Ave
- 8306 Metcalf Ave
- 8309 Floyd St
- 8221 Marty St
- 8215 Marty St
- 8304 Metcalf Ave
- 8306 Floyd St
- 8302 Metcalf Ave
- 8230 Overland Park Dr
- 8300 Metcalf Ave
- 7220 W 83rd St
- 8301 Marty St
- 8315 Floyd St