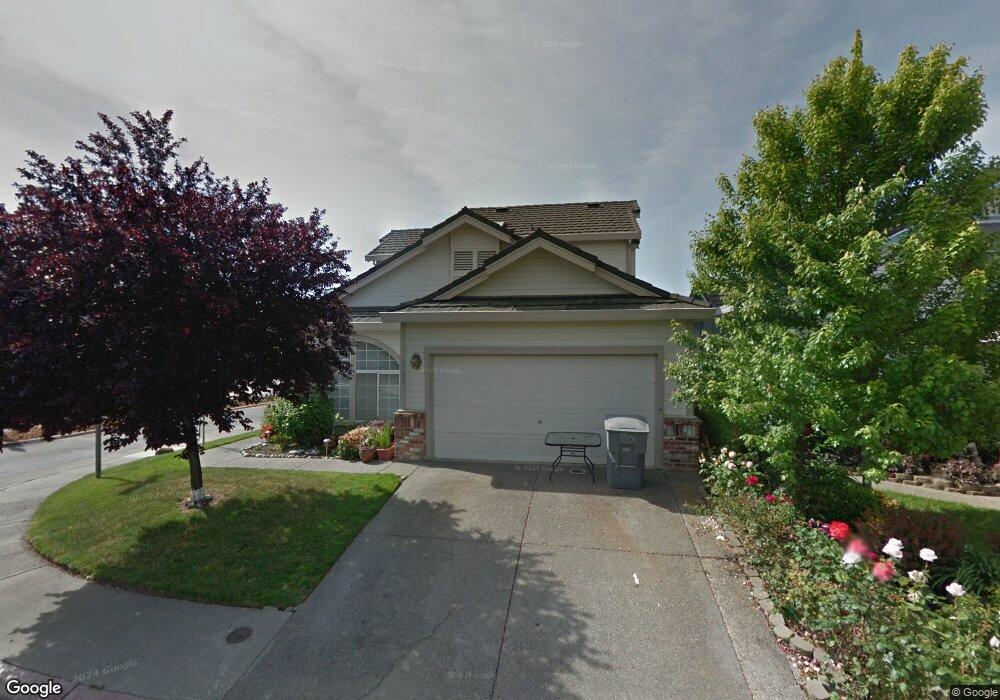
7101 Shoreside Ct Granite Bay, CA 95746
Estimated Value: $639,022 - $723,000
3
Beds
3
Baths
1,912
Sq Ft
$354/Sq Ft
Est. Value
About This Home
This home is located at 7101 Shoreside Ct, Granite Bay, CA 95746 and is currently estimated at $677,006, approximately $354 per square foot. 7101 Shoreside Ct is a home located in Placer County with nearby schools including Greenhills Elementary School, Ridgeview Elementary School, and Willma Cavitt Junior High School.
Ownership History
Date
Name
Owned For
Owner Type
Purchase Details
Closed on
Oct 30, 2020
Sold by
Hasapis Stefan P
Bought by
Hasapis Stefan P
Current Estimated Value
Home Financials for this Owner
Home Financials are based on the most recent Mortgage that was taken out on this home.
Original Mortgage
$207,000
Outstanding Balance
$149,836
Interest Rate
2.9%
Mortgage Type
New Conventional
Estimated Equity
$527,170
Purchase Details
Closed on
Mar 10, 2015
Sold by
Hasapis Peter S and Hasapis Anne P
Bought by
Hasapis Stefan P
Home Financials for this Owner
Home Financials are based on the most recent Mortgage that was taken out on this home.
Original Mortgage
$220,543
Interest Rate
3.61%
Mortgage Type
FHA
Purchase Details
Closed on
Jul 27, 1998
Sold by
Tse Kelvin A and Weideman Tse Cynthia L
Bought by
Aldeborgh John
Create a Home Valuation Report for This Property
The Home Valuation Report is an in-depth analysis detailing your home's value as well as a comparison with similar homes in the area
Home Values in the Area
Average Home Value in this Area
Purchase History
| Date | Buyer | Sale Price | Title Company |
|---|---|---|---|
| Hasapis Stefan P | -- | Fidelity Natl Ttl Co Of Ca | |
| Hasapis Stefan P | -- | Fidelity Natl Ttl Co Of Ca | |
| Hasapis Stefan P | $255,000 | Fidelity National Title Co | |
| Aldeborgh John | $219,000 | Placer Title Company |
Source: Public Records
Mortgage History
| Date | Status | Borrower | Loan Amount |
|---|---|---|---|
| Open | Hasapis Stefan P | $207,000 | |
| Closed | Hasapis Stefan P | $220,543 |
Source: Public Records
Tax History Compared to Growth
Tax History
| Year | Tax Paid | Tax Assessment Tax Assessment Total Assessment is a certain percentage of the fair market value that is determined by local assessors to be the total taxable value of land and additions on the property. | Land | Improvement |
|---|---|---|---|---|
| 2025 | $5,079 | $420,638 | $84,124 | $336,514 |
| 2023 | $5,079 | $404,306 | $80,858 | $323,448 |
| 2022 | $5,004 | $396,379 | $79,273 | $317,106 |
| 2021 | $4,919 | $388,608 | $77,719 | $310,889 |
| 2020 | $4,908 | $384,625 | $76,923 | $307,702 |
| 2019 | $4,874 | $377,084 | $75,415 | $301,669 |
| 2018 | $4,697 | $369,691 | $73,937 | $295,754 |
| 2017 | $4,722 | $362,443 | $72,488 | $289,955 |
| 2016 | $4,627 | $355,337 | $71,067 | $284,270 |
| 2015 | $3,583 | $261,078 | $100,967 | $160,111 |
| 2014 | -- | $255,965 | $98,990 | $156,975 |
Source: Public Records
Map
Nearby Homes
- 7080 Soleil Way
- 8880 Auburn Folsom Rd Unit 20
- 8880 Auburn Folsom Rd Unit 29
- 8880 Auburn Folsom Rd Unit 25
- 8880 Auburn Folsom Rd
- 8464 Sun View Cir
- 8460 Sun View Cir
- 7070 Soleil Way
- 7090 Soleil Way
- 8465 Serene View Rd
- 6872 Brandy Cir
- 9041 Ventura St
- Alder Plan at The Glen in Granite Bay
- Willow Plan at The Glen in Granite Bay
- Sequoia Plan at The Glen in Granite Bay
- 9046 Ventura St
- 9060 Auburn Folsom Rd Unit 22
- 9060 Auburn Folsom Rd Unit 25
- 9060 Auburn Folsom Rd Unit 36
- 9060 Auburn Folsom Rd Unit 7
- 7111 Shoreside Ct
- 7121 Shoreside Ct
- 7200 Harbor Way
- 7204 Harbor Way
- 7100 Shoreside Ct
- 7110 Shoreside Ct
- 7120 Shoreside Ct Unit 2
- 7201 Harbor Way
- 7208 Harbor Way
- 7205 Harbor Way
- 7212 Harbor Way
- 7209 Harbor Way
- 7127 Stillwater Ct
- 7117 Stillwater Ct
- 7137 Stillwater Ct
- 7213 Harbor Way
- 7217 Harbor Way
- 7220 Harbor Way
- 7221 Harbor Way
- 7224 Harbor Way