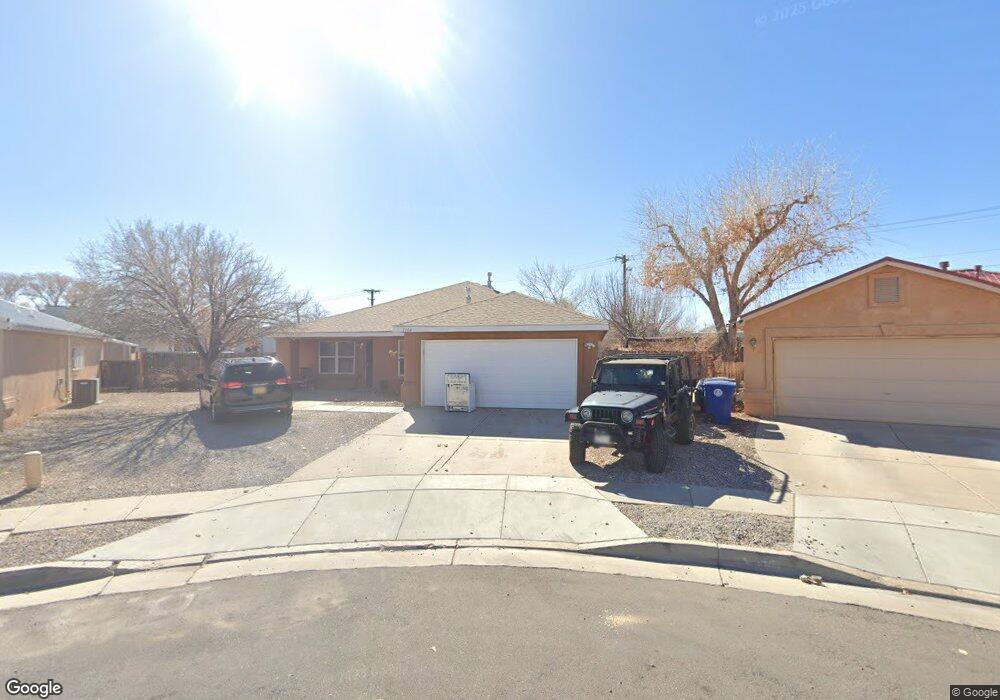
7104 Zinnia Place NW Albuquerque, NM 87121
Los Volcanes NeighborhoodEstimated Value: $308,000 - $371,000
4
Beds
2
Baths
2,089
Sq Ft
$159/Sq Ft
Est. Value
About This Home
This home is located at 7104 Zinnia Place NW, Albuquerque, NM 87121 and is currently estimated at $331,869, approximately $158 per square foot. 7104 Zinnia Place NW is a home located in Bernalillo County with nearby schools including Susie R. Marmon Elementary School, Tony Hillerman Middle School, and West Mesa High School.
Ownership History
Date
Name
Owned For
Owner Type
Purchase Details
Closed on
Mar 10, 2015
Sold by
Cosgrove Kimberlee and Cosgrove Barry
Bought by
Baca May and Baca Timothy
Current Estimated Value
Purchase Details
Closed on
Aug 24, 2007
Sold by
Cedar Creek Homes Inc
Bought by
Cosgrove Barry and Cosgrove Kimberlee
Home Financials for this Owner
Home Financials are based on the most recent Mortgage that was taken out on this home.
Original Mortgage
$151,235
Interest Rate
6.69%
Mortgage Type
FHA
Purchase Details
Closed on
May 16, 2007
Sold by
Litton Loan Servicing Lp
Bought by
Cedar Creek Homes Inc
Purchase Details
Closed on
Jan 15, 1999
Sold by
Kaufman & Broad Of New Mexico Inc
Bought by
Brito Brian K and Brito Yvonne M
Home Financials for this Owner
Home Financials are based on the most recent Mortgage that was taken out on this home.
Original Mortgage
$127,403
Interest Rate
6.66%
Mortgage Type
FHA
Create a Home Valuation Report for This Property
The Home Valuation Report is an in-depth analysis detailing your home's value as well as a comparison with similar homes in the area
Home Values in the Area
Average Home Value in this Area
Purchase History
| Date | Buyer | Sale Price | Title Company |
|---|---|---|---|
| Baca May | -- | Fidelity Natl Title Ins Co | |
| Cosgrove Barry | -- | Fidelity Natl Title Ins Co | |
| Cedar Creek Homes Inc | -- | Fidelity Natl Title Ins Co | |
| Brito Brian K | -- | Fidelity National Title |
Source: Public Records
Mortgage History
| Date | Status | Borrower | Loan Amount |
|---|---|---|---|
| Previous Owner | Cosgrove Barry | $151,235 | |
| Previous Owner | Brito Brian K | $127,403 |
Source: Public Records
Tax History Compared to Growth
Tax History
| Year | Tax Paid | Tax Assessment Tax Assessment Total Assessment is a certain percentage of the fair market value that is determined by local assessors to be the total taxable value of land and additions on the property. | Land | Improvement |
|---|---|---|---|---|
| 2025 | $2,603 | $63,555 | $16,515 | $47,040 |
| 2024 | $2,603 | $61,704 | $16,034 | $45,670 |
| 2023 | $2,560 | $59,907 | $15,567 | $44,340 |
| 2022 | $2,474 | $58,163 | $15,114 | $43,049 |
| 2021 | $2,391 | $56,469 | $14,674 | $41,795 |
| 2020 | $2,352 | $54,825 | $14,247 | $40,578 |
| 2019 | $2,283 | $53,228 | $13,832 | $39,396 |
| 2018 | $2,286 | $53,228 | $13,832 | $39,396 |
| 2017 | $2,335 | $53,661 | $13,832 | $39,829 |
| 2016 | $2,354 | $55,328 | $13,832 | $41,496 |
| 2015 | $50,495 | $50,495 | $13,832 | $36,663 |
| 2014 | $2,160 | $50,862 | $13,832 | $37,030 |
| 2013 | -- | $50,862 | $13,832 | $37,030 |
Source: Public Records
Map
Nearby Homes
- 7001 Zinnia Place NW
- 7412 Mint Place NW
- 804 Landmark St NW
- 728 Mesa Del Rio St NW
- 7313 Aladdin Ct NW
- 6508 Silkwood Ave NW
- 0 Fortuna Rd NW Unit 1090682
- 901 Telstar Loop NW
- 924 Telstar Loop NW
- 905 Telstar Loop NW
- 1221 Tanglewood Place NW
- 1112 Telstar Loop NW
- 1508 Rosewood Ave NW
- 560 Estancia Dr NW
- 461 60th St NW
- 7605 Redwood Dr NW
- 7812 Springwood Rd NW
- 1504 Desert Bloom St NW
- 7827 Springwood Rd NW
- 7717 Sandlewood Dr NW
- 7108 Zinnia Place NW
- 7100 Zinnia Place NW
- 7109 Zinnia Place NW
- 7008 Zinnia Place NW
- 7105 Zinnia Place NW
- 7101 Zinnia Place NW
- 7004 Zinnia Place NW
- 7009 Zinnia Place NW
- 7108 Poppy Place NW
- 7104 Poppy Place NW Unit III
- 7000 Zinnia Place NW
- 7005 Zinnia Place NW
- 7008 Poppy Place NW
- 6908 Zinnia Place NW
- 7004 Poppy Place NW
- 6909 Zinnia Place NW
- 7000 Poppy Place NW
- 7115 Poppy Place NW
- 6801 Los Volcanes Rd NW Unit I