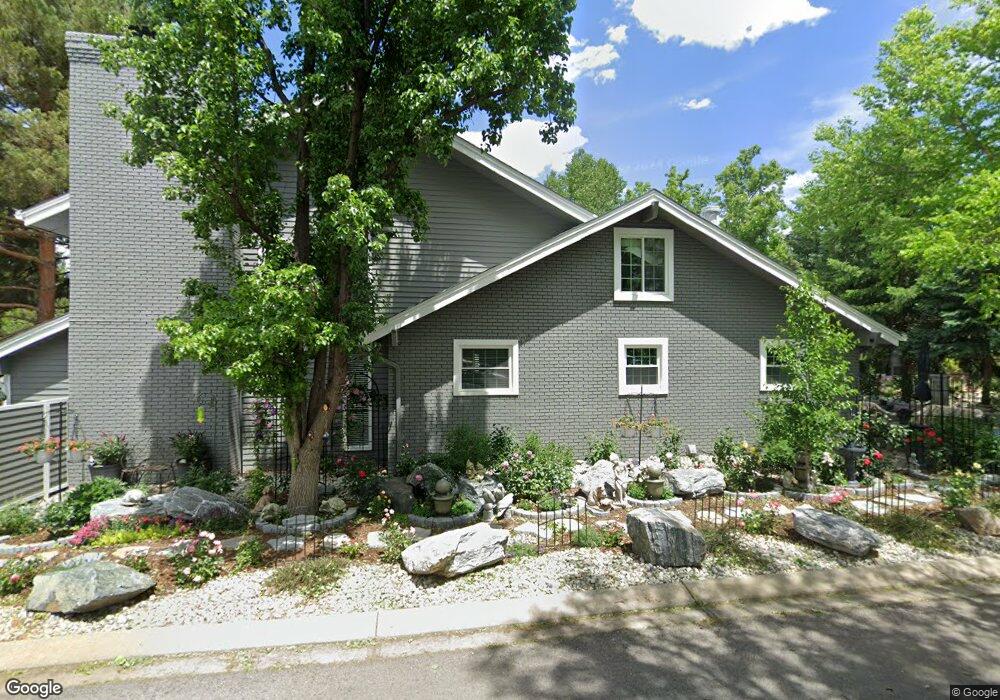
7108 Cedarwood Cir Boulder, CO 80301
Gunbarrel NeighborhoodEstimated Value: $1,118,882 - $1,322,000
3
Beds
3
Baths
2,684
Sq Ft
$458/Sq Ft
Est. Value
About This Home
This home is located at 7108 Cedarwood Cir, Boulder, CO 80301 and is currently estimated at $1,228,221, approximately $457 per square foot. 7108 Cedarwood Cir is a home located in Boulder County with nearby schools including Heatherwood Elementary School, Nevin Platt Middle School, and Boulder High School.
Ownership History
Date
Name
Owned For
Owner Type
Purchase Details
Closed on
Jun 30, 1999
Sold by
Fred Major Properties
Bought by
Sprague David B
Current Estimated Value
Home Financials for this Owner
Home Financials are based on the most recent Mortgage that was taken out on this home.
Original Mortgage
$244,000
Outstanding Balance
$61,379
Interest Rate
7.21%
Estimated Equity
$1,166,842
Purchase Details
Closed on
May 11, 1998
Sold by
Schubert David N
Bought by
Fred Major Properties
Home Financials for this Owner
Home Financials are based on the most recent Mortgage that was taken out on this home.
Original Mortgage
$122,500
Interest Rate
7.5%
Mortgage Type
Seller Take Back
Purchase Details
Closed on
Apr 29, 1993
Bought by
Sprague David B and Sprague Carmina E
Purchase Details
Closed on
Apr 8, 1991
Bought by
Sprague David B and Sprague Carmina E
Create a Home Valuation Report for This Property
The Home Valuation Report is an in-depth analysis detailing your home's value as well as a comparison with similar homes in the area
Home Values in the Area
Average Home Value in this Area
Purchase History
| Date | Buyer | Sale Price | Title Company |
|---|---|---|---|
| Sprague David B | $305,000 | -- | |
| Fred Major Properties | $222,500 | -- | |
| Sprague David B | -- | -- | |
| Sprague David B | $170,000 | -- |
Source: Public Records
Mortgage History
| Date | Status | Borrower | Loan Amount |
|---|---|---|---|
| Open | Sprague David B | $244,000 | |
| Previous Owner | Fred Major Properties | $122,500 | |
| Closed | Sprague David B | $30,500 |
Source: Public Records
Tax History
| Year | Tax Paid | Tax Assessment Tax Assessment Total Assessment is a certain percentage of the fair market value that is determined by local assessors to be the total taxable value of land and additions on the property. | Land | Improvement |
|---|---|---|---|---|
| 2025 | $5,231 | $62,451 | $24,763 | $37,688 |
| 2024 | $5,231 | $62,451 | $24,763 | $37,688 |
| 2023 | $5,145 | $63,215 | $26,787 | $40,113 |
| 2022 | $4,109 | $48,984 | $19,863 | $29,121 |
| 2021 | $3,918 | $50,394 | $20,435 | $29,959 |
| 2020 | $3,519 | $45,539 | $17,804 | $27,735 |
| 2019 | $3,465 | $45,539 | $17,804 | $27,735 |
| 2018 | $3,309 | $43,445 | $14,832 | $28,613 |
| 2017 | $3,211 | $48,031 | $16,398 | $31,633 |
| 2016 | $2,728 | $37,818 | $13,771 | $24,047 |
| 2015 | $3,273 | $34,077 | $18,149 | $15,928 |
| 2014 | $3,023 | $34,077 | $18,149 | $15,928 |
Source: Public Records
Map
Nearby Homes
- 7134 Cedarwood Cir
- 7309 Windsor Dr
- 4953 Clubhouse Ct
- 7088 Indian Peaks Trail
- 4936 Clubhouse Cir
- 4883 Briar Ridge Ct
- 5237 Deer Creek Ct
- 4862 Silver Sage Ct
- 7434 Singing Hills Ct Unit J7434
- 7443 Singing Hills Ct Unit Q
- 5302 Pinehurst Dr
- 7411 Spy Glass Ct Unit N7411
- 5292 Sun Dial Place
- 7447 Singing Hills Ct Unit 202
- 4935 Sundance Square
- 7481 Singing Hills Dr
- 5174 Buckingham Rd Unit L1
- 4803 Briar Ridge Ct
- 5291 Sun Dial Place
- 4872 Country Club Way
- 7106 Cedarwood Cir
- 7104 Cedarwood Cir
- 7112 Cedarwood Cir
- 7111 Cedarwood Cir
- 7107 Cedarwood Cir
- 7102 Cedarwood Cir
- 7105 Cedarwood Cir
- 7114 Cedarwood Cir
- 7103 Cedarwood Cir
- 7116 Cedarwood Cir
- 7188 Cedarwood Cir
- 7184 Cedarwood Cir
- 7120 Cedarwood Cir
- 7180 Cedarwood Cir
- 7122 Cedarwood Cir
- 7197 Cedarwood Cir
- 7193 Cedarwood Cir
- 7176 Cedarwood Cir
- 7201 Cedarwood Cir
- 7205 Cedarwood Cir
Your Personal Tour Guide
Ask me questions while you tour the home.