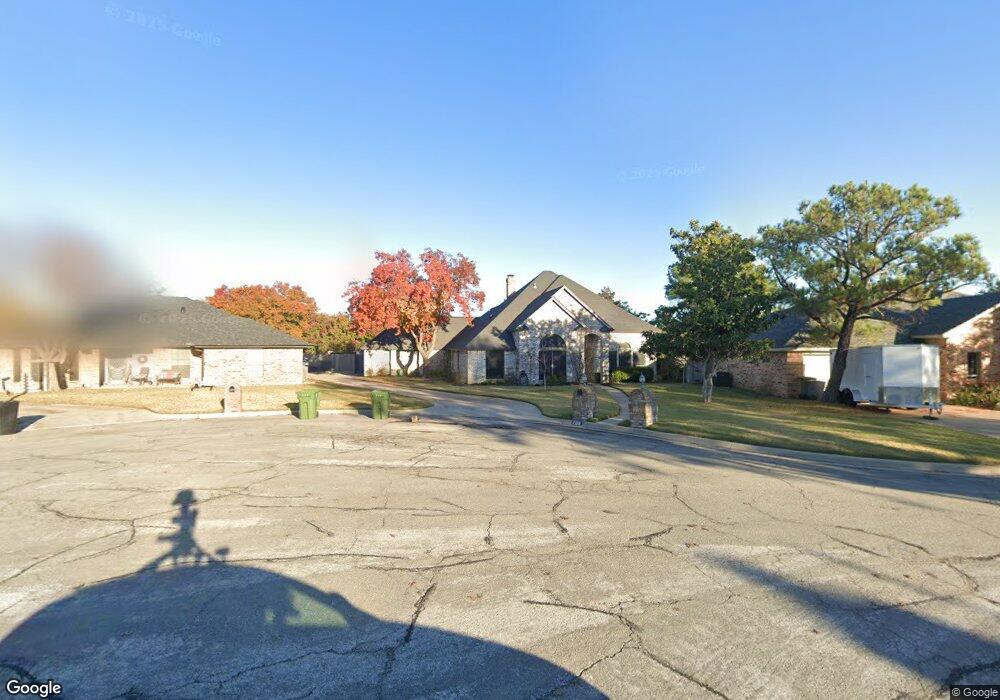
7108 Jeffrey St North Richland Hills, TX 76182
Estimated Value: $395,574 - $439,000
3
Beds
2
Baths
1,849
Sq Ft
$225/Sq Ft
Est. Value
About This Home
This home is located at 7108 Jeffrey St, North Richland Hills, TX 76182 and is currently estimated at $415,144, approximately $224 per square foot. 7108 Jeffrey St is a home located in Tarrant County with nearby schools including W.A. Porter Elementary School, Smithfield Middle School, and Birdville High School.
Ownership History
Date
Name
Owned For
Owner Type
Purchase Details
Closed on
Nov 13, 2014
Sold by
Mahanay Jason P
Bought by
Smith Troy J and Smith Rebecca L
Current Estimated Value
Home Financials for this Owner
Home Financials are based on the most recent Mortgage that was taken out on this home.
Original Mortgage
$152,475
Outstanding Balance
$117,699
Interest Rate
4.21%
Mortgage Type
New Conventional
Estimated Equity
$297,445
Purchase Details
Closed on
Apr 19, 2004
Sold by
Mclaughlin Debbie
Bought by
Mahanay Jason P
Home Financials for this Owner
Home Financials are based on the most recent Mortgage that was taken out on this home.
Original Mortgage
$108,250
Interest Rate
5.42%
Mortgage Type
Purchase Money Mortgage
Create a Home Valuation Report for This Property
The Home Valuation Report is an in-depth analysis detailing your home's value as well as a comparison with similar homes in the area
Home Values in the Area
Average Home Value in this Area
Purchase History
| Date | Buyer | Sale Price | Title Company |
|---|---|---|---|
| Smith Troy J | -- | None Available | |
| Mahanay Jason P | -- | Commonwealth Land |
Source: Public Records
Mortgage History
| Date | Status | Borrower | Loan Amount |
|---|---|---|---|
| Open | Smith Troy J | $152,475 | |
| Previous Owner | Mahanay Jason P | $108,250 | |
| Closed | Mahanay Jason P | $13,500 |
Source: Public Records
Tax History Compared to Growth
Tax History
| Year | Tax Paid | Tax Assessment Tax Assessment Total Assessment is a certain percentage of the fair market value that is determined by local assessors to be the total taxable value of land and additions on the property. | Land | Improvement |
|---|---|---|---|---|
| 2025 | $5,645 | $387,412 | $70,000 | $317,412 |
| 2024 | $5,645 | $387,412 | $70,000 | $317,412 |
| 2023 | $6,836 | $337,902 | $70,000 | $267,902 |
| 2022 | $6,817 | $318,377 | $45,000 | $273,377 |
| 2021 | $6,553 | $257,529 | $45,000 | $212,529 |
| 2020 | $6,133 | $241,048 | $45,000 | $196,048 |
| 2019 | $6,388 | $242,569 | $45,000 | $197,569 |
| 2018 | $5,441 | $228,014 | $45,000 | $183,014 |
| 2017 | $5,577 | $220,770 | $45,000 | $175,770 |
| 2016 | $5,070 | $188,441 | $35,000 | $153,441 |
| 2015 | $3,887 | $158,100 | $18,000 | $140,100 |
| 2014 | $3,887 | $158,100 | $18,000 | $140,100 |
Source: Public Records
Map
Nearby Homes
- 8966 Hialeah Cir S
- 7104 Melissa Ct
- 7321 Fallen Oak Dr
- 7317 Hialeah Cir W
- 7216 Everglade Dr
- 7020 Live Oak Dr
- 9205 Cooper Ct
- 9017 Rumfield Rd
- 3317 S Riley Ct
- TBD Kirk Ln
- 3229 David Dr
- 3233 David Dr
- 717 Reese Ln
- 713 Paul Dr
- 3512 Osprey Dr
- 6708 Nob Hill Ct
- 8440 Stephanie Dr
- 6704 Nob Hill Ct
- 616A Plan at Adkins Park - 70'
- 655A Plan at Adkins Park - 70'
- 7104 Jeffrey St
- 7109 Gregg Ct
- 7112 Jeffrey St
- 7116 Jeffrey St
- 7100 Jeffrey St
- 7105 Gregg Ct
- 7113 Gregg Ct
- 8905 Ashcraft Dr
- 7109 Jeffrey St
- 7105 Jeffrey St
- 7113 Jeffrey St
- 8909 Ashcraft Dr
- 8962 Hialeah Cir S
- 7101 Jeffrey St
- 8958 Hialeah Cir S
- 7117 Gregg Ct
- 8970 Hialeah Cir S
- 7108 Nicole Ct
- 8954 Hialeah Cir S
- 8974 Hialeah Cir S