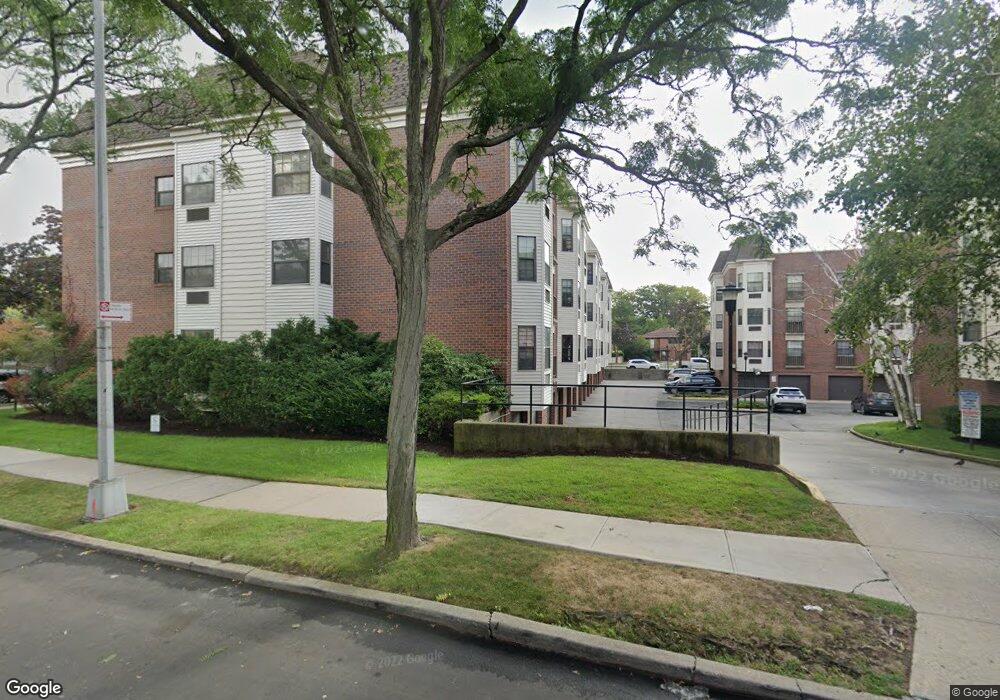
7109 163rd St Unit 3252 Fresh Meadows, NY 11365
Pomonok NeighborhoodEstimated Value: $701,000 - $767,000
--
Bed
--
Bath
1,232
Sq Ft
$594/Sq Ft
Est. Value
About This Home
This home is located at 7109 163rd St Unit 3252, Fresh Meadows, NY 11365 and is currently estimated at $731,892, approximately $594 per square foot. 7109 163rd St Unit 3252 is a home located in Queens County with nearby schools including I.S. 250 - The Robert F. Kennedy Community Middle School.
Ownership History
Date
Name
Owned For
Owner Type
Purchase Details
Closed on
Aug 15, 2018
Sold by
Krishnan Hari and Vaidyanathan Visalakshi
Bought by
Liu Jinming
Current Estimated Value
Purchase Details
Closed on
Apr 28, 2010
Sold by
Ursino Catherine
Bought by
Krishnan Hari and Vaidyanathan Visalakshi
Home Financials for this Owner
Home Financials are based on the most recent Mortgage that was taken out on this home.
Original Mortgage
$382,500
Interest Rate
5.11%
Mortgage Type
Purchase Money Mortgage
Purchase Details
Closed on
Nov 18, 2008
Sold by
Ursino Catherine
Bought by
Ursino Catherine
Create a Home Valuation Report for This Property
The Home Valuation Report is an in-depth analysis detailing your home's value as well as a comparison with similar homes in the area
Home Values in the Area
Average Home Value in this Area
Purchase History
| Date | Buyer | Sale Price | Title Company |
|---|---|---|---|
| Liu Jinming | $665,000 | -- | |
| Krishnan Hari | $425,000 | -- | |
| Ursino Catherine | -- | -- |
Source: Public Records
Mortgage History
| Date | Status | Borrower | Loan Amount |
|---|---|---|---|
| Previous Owner | Krishnan Hari | $382,500 |
Source: Public Records
Tax History Compared to Growth
Tax History
| Year | Tax Paid | Tax Assessment Tax Assessment Total Assessment is a certain percentage of the fair market value that is determined by local assessors to be the total taxable value of land and additions on the property. | Land | Improvement |
|---|---|---|---|---|
| 2025 | $5,996 | $30,082 | $621 | $29,461 |
| 2024 | $5,996 | $29,855 | $643 | $29,212 |
| 2023 | $5,657 | $28,165 | $632 | $27,533 |
| 2022 | $5,035 | $41,233 | $993 | $40,240 |
| 2021 | $5,276 | $36,874 | $993 | $35,881 |
| 2020 | $5,293 | $38,126 | $993 | $37,133 |
| 2019 | $5,204 | $39,411 | $993 | $38,418 |
| 2018 | $4,785 | $23,471 | $742 | $22,729 |
| 2017 | $4,514 | $22,143 | $715 | $21,428 |
| 2016 | $4,176 | $22,143 | $715 | $21,428 |
| 2015 | $2,520 | $20,890 | $763 | $20,127 |
| 2014 | $2,520 | $20,733 | $787 | $19,946 |
Source: Public Records
Map
Nearby Homes
- 71-34 163rd St Unit 3
- 71-24 163rd St Unit 5A
- 71-33 162nd St Unit 4B
- 163-07 72nd Ave Unit 5C
- 163-07 72nd Ave Unit 5A
- 163-07 72nd Ave Unit 2D
- 163-07 72nd Ave Unit 2G
- 163-07 72nd Ave Unit 4E
- 163-07 72nd Ave Unit 2C
- 163-07 72nd Ave Unit 5F
- 163-07 72nd Ave Unit 5b
- 163-07 72nd Ave Unit 2A
- 163-07 72nd Ave Unit 4H
- 72-05 164th St
- 7111 Sutton Place Unit 3
- 7129 Sutton Place Unit 3
- 71-37 166th St
- 71-39 166th St
- 71-28 Sutton Place Unit 3
- 71-18 Sutton Place Unit 3
- 71-09 163rd St Unit 2
- 71-09 163rd St
- 71-09 163rd St Unit 3
- 7109 163rd St
- 7109 163rd St Unit 3251
- 7109 163rd St
- 71-09 163rd St Unit 3253
- 7109 163rd St Unit 3253
- 7111 163rd St Unit 3242
- 7111 163rd St
- 7111 163rd St Unit 3
- 71-11 163rd St Unit 2
- 71-11 163rd St Unit 3242
- 71-11 163rd St Unit 1
- 7111 163rd St Unit 3241
- 7111 163rd St Unit 3243
- 71-21 163rd St Unit 3203
- 71-15 163rd St Unit 1
- 7115 163rd St
- 7115 163rd St