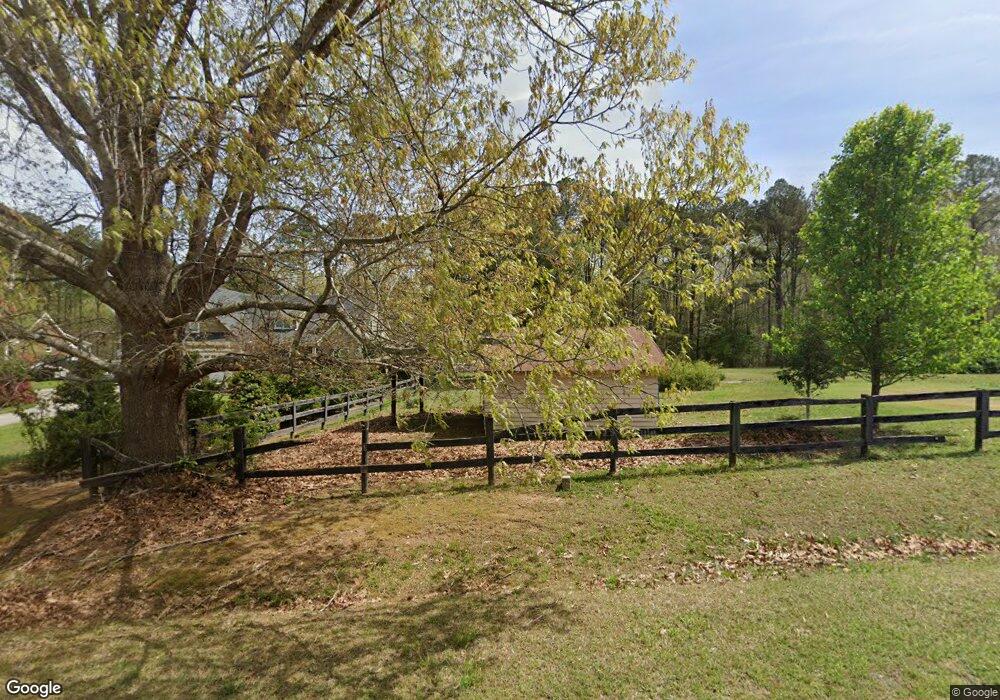
7109 Denlee Rd Raleigh, NC 27603
Estimated Value: $242,000 - $411,000
--
Bed
--
Bath
660
Sq Ft
$493/Sq Ft
Est. Value
About This Home
This home is located at 7109 Denlee Rd, Raleigh, NC 27603 and is currently estimated at $325,123, approximately $492 per square foot. 7109 Denlee Rd is a home located in Wake County with nearby schools including Yates Mill Elementary School, Dillard Drive Magnet Middle School, and Middle Creek High.
Ownership History
Date
Name
Owned For
Owner Type
Purchase Details
Closed on
Nov 19, 2020
Sold by
Hibbard James P and Hibbard Kimberly S
Bought by
Hibbard James P and Hibbard Kimberly S
Current Estimated Value
Purchase Details
Closed on
Jul 10, 2006
Sold by
Krueger Properties Llc
Bought by
Hibbard James P and Hibbard Kimberly S
Purchase Details
Closed on
Nov 15, 2002
Sold by
Krueger Richard and Kirks Krueger Wanda Joy
Bought by
Krueger Properties Llc
Purchase Details
Closed on
Apr 2, 2002
Sold by
Kirks Linda S and Kirks Christopher T
Bought by
Krueger Richard and Kirks Krueger Wanda Joy
Purchase Details
Closed on
Apr 13, 2000
Sold by
Hoover Garry H
Bought by
Kim Young Hwan and Lee Ki Sun
Purchase Details
Closed on
Apr 12, 1998
Sold by
Sorrell Paul Richardson and Sorrell Joyce S
Bought by
Kirks Linda S
Home Financials for this Owner
Home Financials are based on the most recent Mortgage that was taken out on this home.
Original Mortgage
$30,600
Interest Rate
7.14%
Create a Home Valuation Report for This Property
The Home Valuation Report is an in-depth analysis detailing your home's value as well as a comparison with similar homes in the area
Home Values in the Area
Average Home Value in this Area
Purchase History
| Date | Buyer | Sale Price | Title Company |
|---|---|---|---|
| Hibbard James P | -- | None Available | |
| Hibbard James P | $115,000 | None Available | |
| Krueger Properties Llc | -- | -- | |
| Krueger Richard | $77,000 | -- | |
| Kim Young Hwan | $50,000 | -- | |
| Kirks Linda S | $36,000 | -- |
Source: Public Records
Mortgage History
| Date | Status | Borrower | Loan Amount |
|---|---|---|---|
| Previous Owner | Kirks Linda S | $30,600 |
Source: Public Records
Tax History Compared to Growth
Tax History
| Year | Tax Paid | Tax Assessment Tax Assessment Total Assessment is a certain percentage of the fair market value that is determined by local assessors to be the total taxable value of land and additions on the property. | Land | Improvement |
|---|---|---|---|---|
| 2025 | $1,153 | $180,320 | $178,800 | $1,520 |
| 2024 | $1,120 | $180,320 | $178,800 | $1,520 |
| 2023 | $1,019 | $130,690 | $129,500 | $1,190 |
| 2022 | $944 | $130,690 | $129,500 | $1,190 |
| 2021 | $918 | $130,690 | $129,500 | $1,190 |
| 2020 | $903 | $130,690 | $129,500 | $1,190 |
| 2019 | $1,000 | $122,450 | $122,000 | $450 |
| 2018 | $919 | $122,450 | $122,000 | $450 |
| 2017 | $871 | $122,450 | $122,000 | $450 |
| 2016 | $853 | $122,450 | $122,000 | $450 |
| 2015 | -- | $120,920 | $120,500 | $420 |
| 2014 | -- | $120,920 | $120,500 | $420 |
Source: Public Records
Map
Nearby Homes
- 6913 Lake Wheeler Rd
- 3204 Manor Ridge Dr
- 3613 Cross Timber Ln
- 3716 Cross Timber Ln
- 7612 Fayetteville Rd
- 246 Broomside Ave
- 5702 Volos Ave
- 5317 Burning Oak Ct
- 5300 Trilogy Farm Dr
- 7625 Fayetteville Rd
- 716 Ben Ledi Ct
- 529 Prestonfield Way
- 3901 Bluffwind Dr
- 416 Grange Farm Place
- 521 Prestonfield Way
- 5009 Megara Run
- 3728 Westbury Lake Dr
- 457 Grange Farm Place
- 414 Grange Farm Place
- 464 Grange Farm Place
- 7105 Denlee Rd
- lot 1 Denlee Rd
- lot 4 Denlee Rd
- lot 6 Denlee Rd
- Lot 5 Denlee Rd
- Lot 3 Denlee Rd
- lot 2 Denlee Rd
- Lot 7 Denlee Rd
- 1 Denlee Rd
- 7101 Denlee Rd
- 7108 Denlee Rd
- 7200 Denlee Rd
- 7017 Denlee Rd
- 7318 Lake Wheeler Rd
- 7204 Denlee Rd
- 1913 Lost Cove Ln
- 7100 Denlee Rd
- 7313 Denlee Rd
- 7015 Denlee Rd
- 7220 Denlee Rd