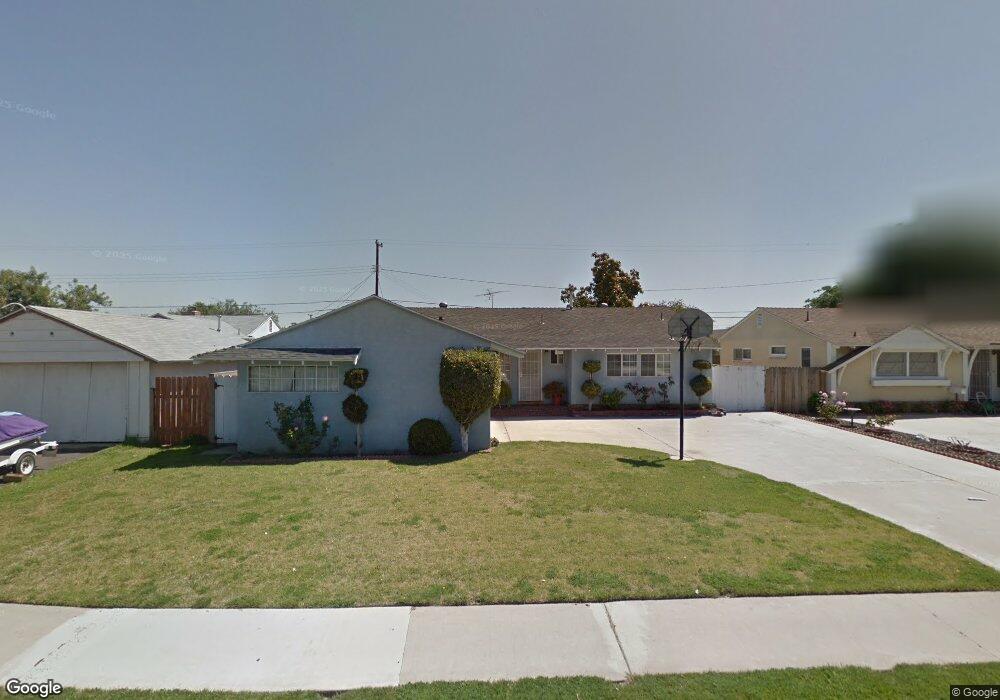
7109 Hoover Way Buena Park, CA 90620
Estimated Value: $877,689 - $979,000
4
Beds
2
Baths
1,704
Sq Ft
$555/Sq Ft
Est. Value
About This Home
This home is located at 7109 Hoover Way, Buena Park, CA 90620 and is currently estimated at $945,922, approximately $555 per square foot. 7109 Hoover Way is a home located in Orange County with nearby schools including Centralia Elementary School, Orangeview Junior High, and Western High School.
Ownership History
Date
Name
Owned For
Owner Type
Purchase Details
Closed on
Aug 8, 2010
Sold by
Aziz Naheed
Bought by
Aziz Naheed and The Naheed Aziz Living Trust
Current Estimated Value
Purchase Details
Closed on
Aug 13, 2003
Sold by
Aziz Naheed and Saleem Naheed
Bought by
Aziz Naheed
Home Financials for this Owner
Home Financials are based on the most recent Mortgage that was taken out on this home.
Original Mortgage
$122,000
Outstanding Balance
$52,431
Interest Rate
5.29%
Mortgage Type
Purchase Money Mortgage
Estimated Equity
$893,491
Purchase Details
Closed on
Feb 29, 2000
Sold by
Saleem Shaikh and Saleem Naheed
Bought by
Aziz Naheed and Saleem Naheed
Purchase Details
Closed on
Sep 12, 1996
Sold by
Pariseau Dennis J and Pariseau Rhonda Rhonda
Bought by
Shaikh Saleem M and Saleem Naheed
Home Financials for this Owner
Home Financials are based on the most recent Mortgage that was taken out on this home.
Original Mortgage
$133,600
Interest Rate
7.91%
Create a Home Valuation Report for This Property
The Home Valuation Report is an in-depth analysis detailing your home's value as well as a comparison with similar homes in the area
Home Values in the Area
Average Home Value in this Area
Purchase History
| Date | Buyer | Sale Price | Title Company |
|---|---|---|---|
| Aziz Naheed | -- | None Available | |
| Aziz Naheed | -- | Ticor Title Company | |
| Aziz Naheed | -- | -- | |
| Shaikh Saleem M | $167,000 | United Title Company |
Source: Public Records
Mortgage History
| Date | Status | Borrower | Loan Amount |
|---|---|---|---|
| Open | Aziz Naheed | $122,000 | |
| Previous Owner | Shaikh Saleem M | $133,600 |
Source: Public Records
Tax History Compared to Growth
Tax History
| Year | Tax Paid | Tax Assessment Tax Assessment Total Assessment is a certain percentage of the fair market value that is determined by local assessors to be the total taxable value of land and additions on the property. | Land | Improvement |
|---|---|---|---|---|
| 2025 | $3,266 | $271,980 | $181,786 | $90,194 |
| 2024 | $3,266 | $266,648 | $178,222 | $88,426 |
| 2023 | $3,182 | $261,420 | $174,727 | $86,693 |
| 2022 | $3,138 | $256,295 | $171,301 | $84,994 |
| 2021 | $3,093 | $251,270 | $167,942 | $83,328 |
| 2020 | $3,073 | $248,694 | $166,220 | $82,474 |
| 2019 | $2,999 | $243,818 | $162,961 | $80,857 |
| 2018 | $2,945 | $239,038 | $159,766 | $79,272 |
| 2017 | $2,854 | $234,351 | $156,633 | $77,718 |
| 2016 | $2,800 | $229,756 | $153,561 | $76,195 |
| 2015 | $2,767 | $226,305 | $151,254 | $75,051 |
| 2014 | $2,631 | $221,872 | $148,291 | $73,581 |
Source: Public Records
Map
Nearby Homes
- 7173 Monroe Ave
- 6741 Lincoln Ave Unit 108
- 6741 Lincoln Ave Unit 155
- 6893 San Bruno Dr
- 6741 W Lincoln Ave Unit 32
- 7545 Jackson Way
- 3238 W Cabot Dr
- 6932 San Diego Dr
- 3131 W Polk Ave
- 17 Citrus Glen
- 7114 Santa Isabel Cir
- 3402 W Danbrook Ave
- 8214 Santa Inez Way
- 9009 Harvard Ave
- 8178 Santa Inez Dr
- 7950 Jackson Way
- 3053 W Coolidge Ave
- 6507 San Alano Cir
- 6528 University Way
- 6681 Via Arroyo Dr
- 7115 Hoover Way
- 7105 Hoover Way
- 8691 Harrison Way
- 8679 Harrison Way
- 8703 Harrison Way
- 7119 Hoover Way
- 7099 Hoover Way
- 7102 Hoover Way
- 7096 Hoover Way
- 8715 Harrison Way
- 8667 Harrison Way
- 7108 Hoover Way
- 7095 Hoover Way
- 7125 Hoover Way
- 8655 Harrison Way
- 8725 Harrison Way
- 7089 Hoover Way
- 7090 Hoover Way
- 7114 Hoover Way
- 7085 Hoover Way