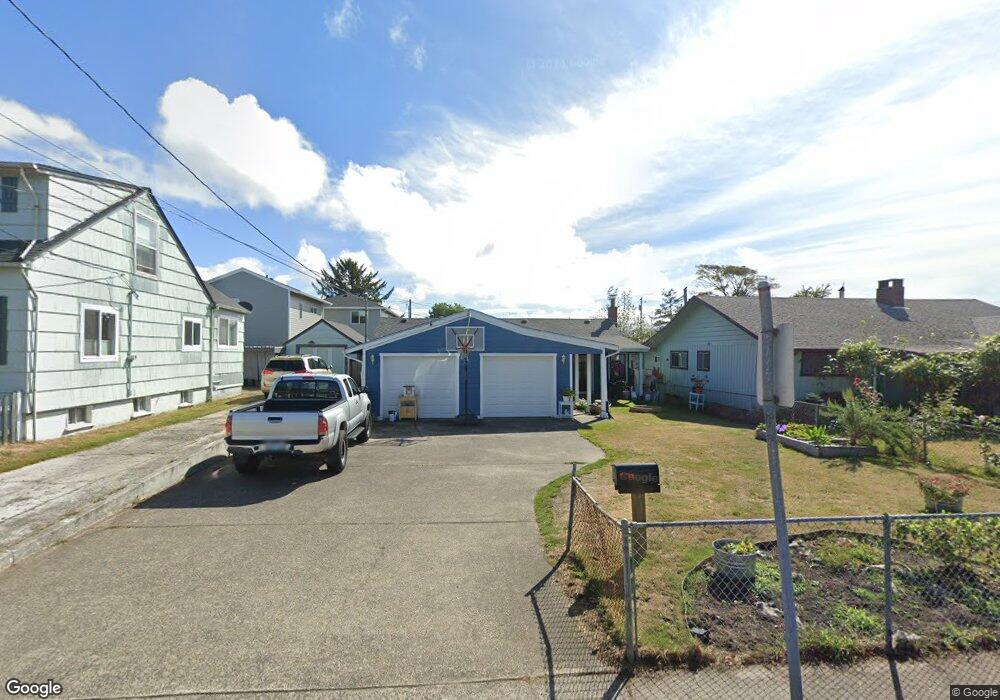
711 10th Ave Seaside, OR 97138
Estimated Value: $387,000 - $444,107
2
Beds
2
Baths
1,080
Sq Ft
$382/Sq Ft
Est. Value
About This Home
This home is located at 711 10th Ave, Seaside, OR 97138 and is currently estimated at $412,777, approximately $382 per square foot. 711 10th Ave is a home located in Clatsop County with nearby schools including Seaside High School.
Ownership History
Date
Name
Owned For
Owner Type
Purchase Details
Closed on
Jun 6, 2025
Sold by
Bautista Santiago Jose
Bought by
Jose Bautista And Mayra Sanchez Revocable Liv and Santiago
Current Estimated Value
Purchase Details
Closed on
Mar 6, 2019
Sold by
Lynch Brian F and Lynch Hwacha L
Bought by
Bautista Jose
Home Financials for this Owner
Home Financials are based on the most recent Mortgage that was taken out on this home.
Original Mortgage
$206,196
Interest Rate
4.62%
Mortgage Type
FHA
Create a Home Valuation Report for This Property
The Home Valuation Report is an in-depth analysis detailing your home's value as well as a comparison with similar homes in the area
Purchase History
| Date | Buyer | Sale Price | Title Company |
|---|---|---|---|
| Jose Bautista And Mayra Sanchez Revocable Liv | -- | None Listed On Document | |
| Bautista Jose | $210,000 | Pacific Title Company |
Source: Public Records
Mortgage History
| Date | Status | Borrower | Loan Amount |
|---|---|---|---|
| Previous Owner | Bautista Jose | $206,196 |
Source: Public Records
Tax History
| Year | Tax Paid | Tax Assessment Tax Assessment Total Assessment is a certain percentage of the fair market value that is determined by local assessors to be the total taxable value of land and additions on the property. | Land | Improvement |
|---|---|---|---|---|
| 2025 | $2,969 | $206,613 | -- | -- |
| 2024 | $2,882 | $200,596 | -- | -- |
| 2023 | $2,797 | $194,755 | $0 | $0 |
| 2022 | $2,720 | $189,083 | $0 | $0 |
| 2021 | $2,663 | $183,577 | $0 | $0 |
| 2020 | $2,600 | $178,231 | $0 | $0 |
| 2019 | $2,529 | $173,040 | $0 | $0 |
| 2018 | $2,429 | $168,001 | $0 | $0 |
| 2017 | $2,318 | $163,109 | $0 | $0 |
| 2016 | $2,039 | $158,359 | $46,859 | $111,500 |
| 2015 | $1,986 | $153,748 | $45,495 | $108,253 |
| 2014 | $1,980 | $149,270 | $0 | $0 |
| 2013 | -- | $144,923 | $0 | $0 |
Source: Public Records
Map
Nearby Homes
- 1000 N Holladay Dr Unit 402
- 1000 N Holladay Dr
- 1000 N Holladay Dr Unit 304
- 815 N King St
- 1110 6th Ave
- 1299 6th Ave
- 908-910 N Franklin St
- 321 N Holladay Dr
- 245 12th Ave
- 1022 N Prom Tradewinds Condo
- 1022 N Prom Tradewinds Condo Unit 208
- 1022 N Promenade Unit 208
- 811 17th Ave
- 1350 13th Ave
- 790 17th Ave
- 337 16th Ave
- 423 N Downing St
- 911 1st Ave
- 0 N Wahanna Rd
- 830 Oceanway St
Your Personal Tour Guide
Ask me questions while you tour the home.